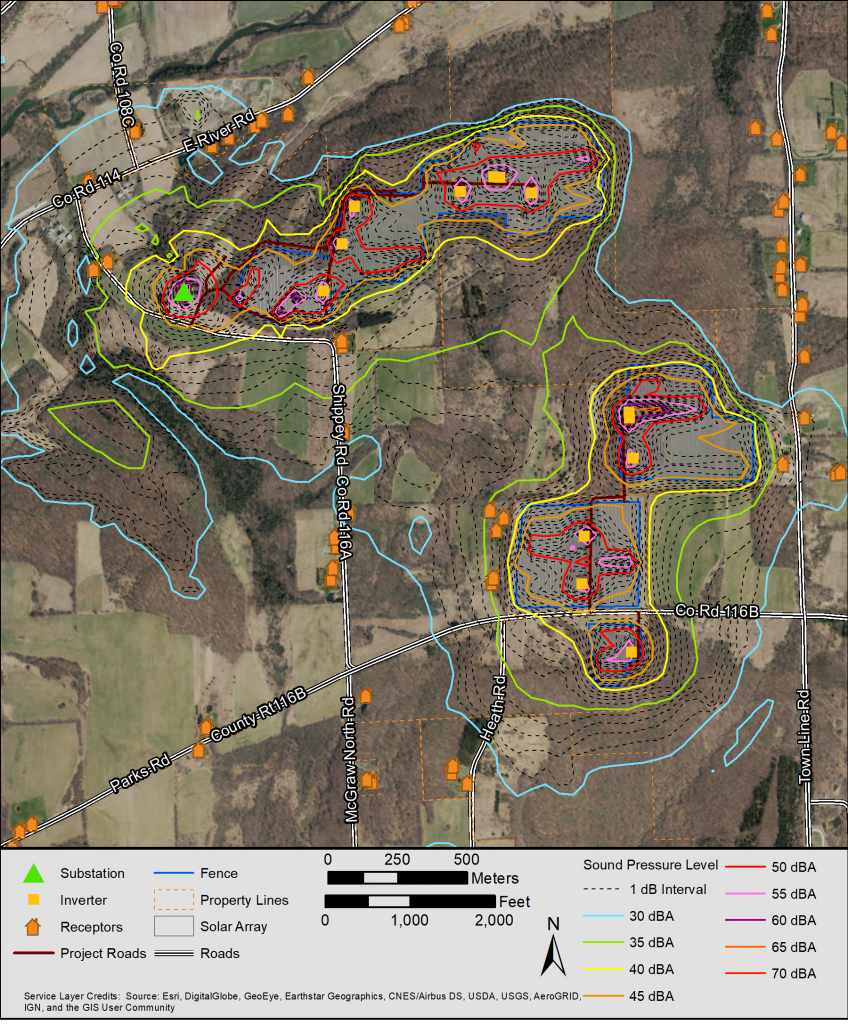
Homer Solar Farm Noise Assessment

Homer Solar Farm is a proposed 90-megawatt solar energy generation facility in New York State. As part of the permitting process, EDF Renewables sought noise control engineering services to comply with New York Codes, Rules, and Regulations (NYCRR), Part 900 (also known as Section 94-c).

RSG completed a project noise impact assessment for the facility. As part of our noise impact assessment, we conducted background sound level monitoring at the site. Monitoring took place during both the winter and summer to account for various foliage conditions. Our team selected monitoring positions to represent diverse soundscapes. This ensured adequate representativeness while avoiding impacts from human sound sources such as highways.

After establishing a baseline noise condition, our team conducted sound propagation modeling following the ISO 9613-2 standard and procedures. We used the Cadna/A sound prediction model. This model considers varying terrain, source spectral content, and several other factors that influence sound attenuation and propagation. Sound modeling was conducted for 4 operational scenarios, 2 cumulative scenarios, and 15 construction scenarios to meet the Office of Renewable Energy Siting requirements. We also designed mitigation for the developers to incorporate into the facility so it could meet Section 94-c noise standards. Mitigation included the use of low-noise transformers and a sound barrier at the proposed substation.

After completing site monitoring and modeling for Homer Solar Farm, RSG documented our findings in a report. This report included information on local and state noise limits, sound level monitoring procedures and results, sound modeling procedures and results, noise contour mapping, and construction noise results.

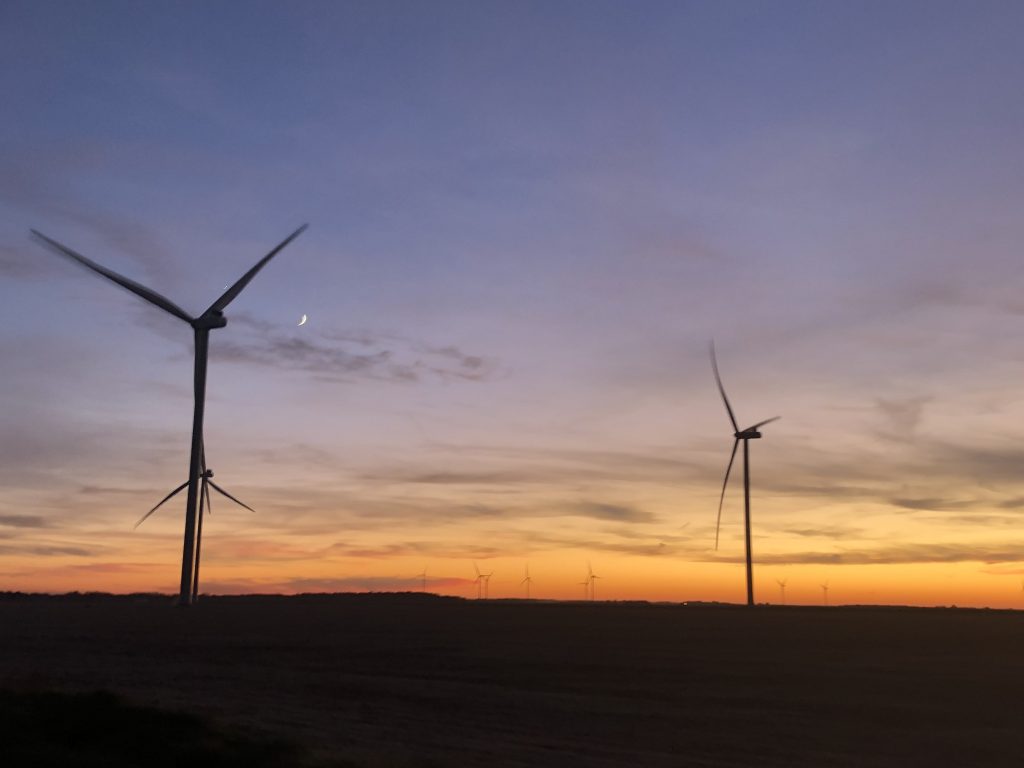
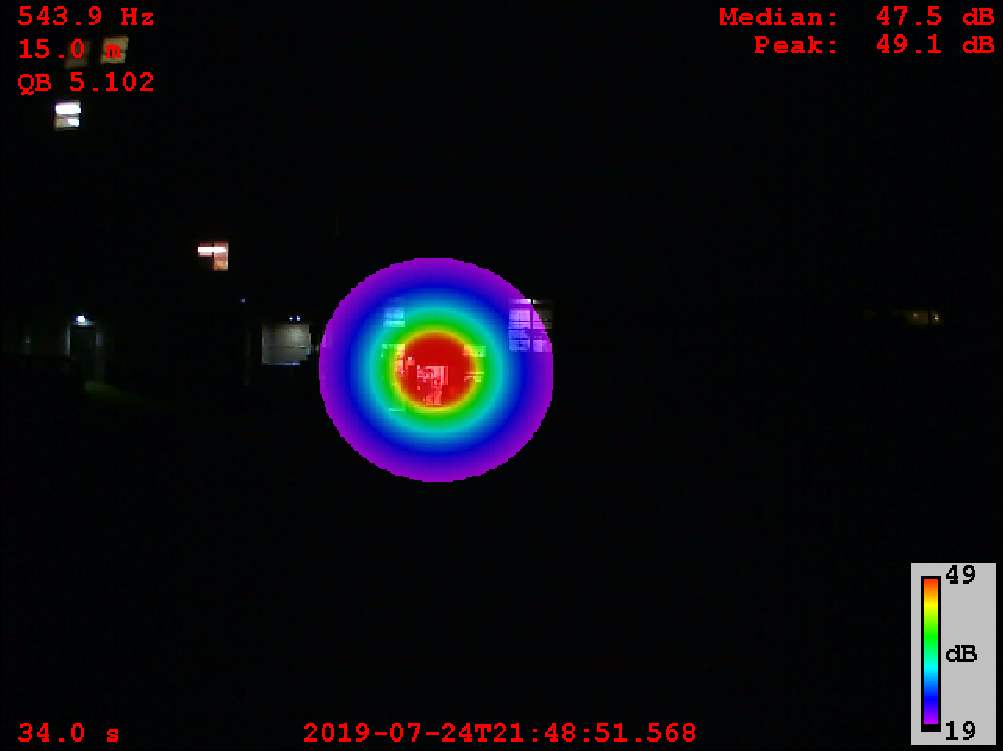
Sugar Creek Wind Project Preconstruction Modeling and Postconstruction Monitoring

The Sugar Creek Wind Project is a 57-turbine wind farm in Logan County, Illinois, with a capacity of up to 202 megawatts. The project is owned by Sugar Creek Wind One, LLC, a subsidiary of Liberty Renewables. As part of the permitting process for both the preconstruction and postconstruction phases, the developers sought noise control engineering services.

Preconstruction Sound Level Measurements

RSG worked with the previous developer to assess the noise impacts of up to 117 wind turbines, which the county permitted. In 2019, the new developer filed an amendment to reduce the final array to 57 wind turbines. During the preconstruction permitting process, RSG worked with the project’s developers to assess the project’s compliance with county ordinances and state noise standards defined by the Illinois Pollution Control Board (IPCB). RSG conducted sound measurements at the site to document baseline ambient sound levels. In addition, our team conducted sound propagation modeling to assess noise during construction and operations. Our preconstruction models/reports found that the project complied with IPCB daytime and nighttime sound limits. By extension, this meant the project met the Logan County noise standard at all participating and nonparticipating residences.

Postconstruction Sound Level Measurements

Completion of construction at the end of 2020 necessitated postconstruction sound level measurements. These compared project-generated sound levels to IPCB noise standards as applicable under the project’s conditional use permit. RSG again worked with the project’s developer to conduct postconstruction sound monitoring at the site. To start, we selected 38 sites for postconstruction sound monitoring. Our team conducted a substantial field campaign to measure hourly sound levels at night using attended sound monitoring. Then, over approximately two months, we measured sound levels at all 38 locations. Our team used the measurement results to calculate postconstruction sound levels at all 141 primary structures in the project area.

Our final report found that project-generated sound levels met the IPCB daytime and nighttime sound limits at all primary structures analyzed. In addition, we found that none of the measured sites had discrete tones attributable to the turbines.

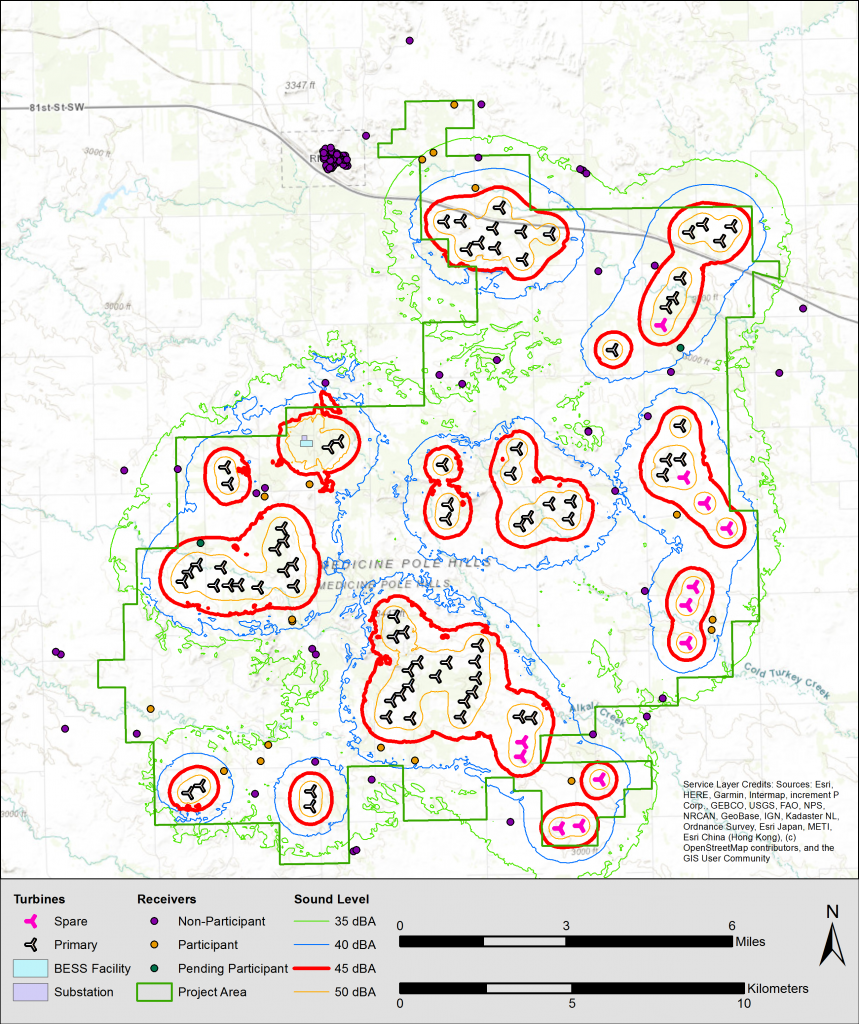
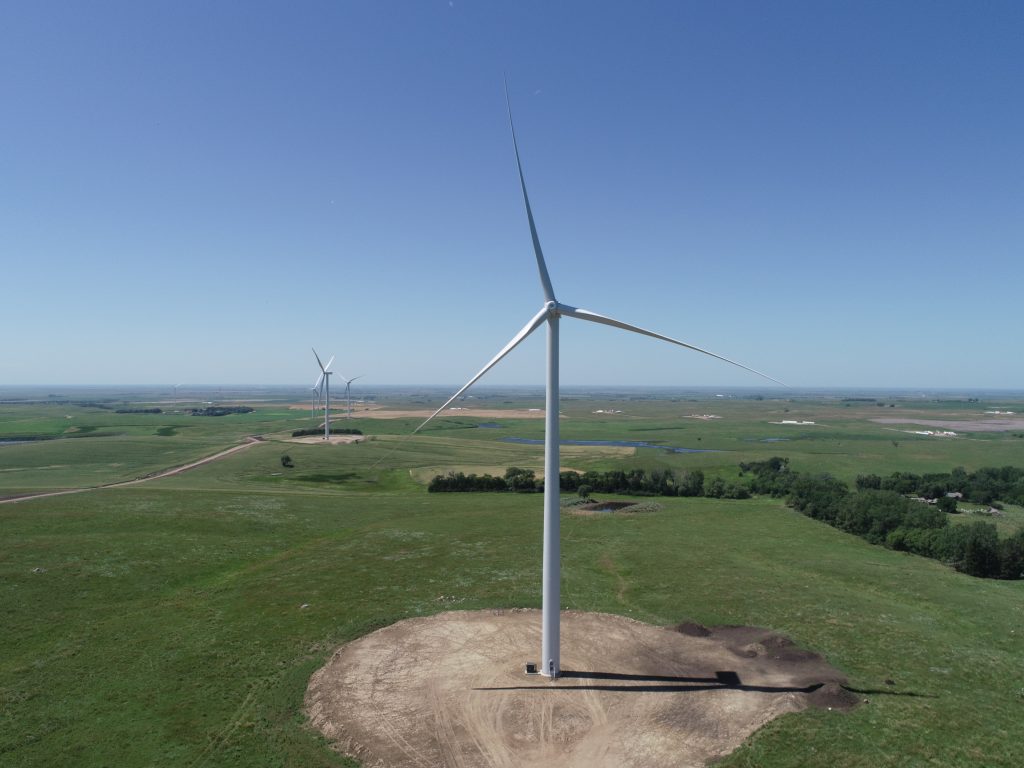
Bowman Wind Farm Sound Propagation Modeling

The Bowman Wind Farm is a proposed 200-megawatt (MW) wind energy facility in southwest North Dakota. The site also includes a 400 MWh battery energy storage system. As part of the permitting process for the Bowman Wind Farm, Apex Clean Energy sought noise control engineering services. These services were in support of Apex’s application for a project permit and to assess compliance with existing North Dakota Public Service Commission standards and applicable local regulations.

RSG’s work included preparing a modeling report for the project and participating in testimony and a hearing. Our team conducted sound propagation modeling using IEC 61400-14 manufacturer sound power levels. In addition, we followed the ISO 9613-2 standard and procedures outlined in “Regulating and Predicting Wind Turbine Sound in the U.S.” We used the Cadna/A sound prediction model. This considers varying terrain, source spectral content, and several other factors that influence sound attenuation and propagation.

The final report we prepared discussed local and state noise limits, provided site maps, and described our modeling procedures. It documented modeled results from the proposed wind turbines and substation. The report also documented modeled results from the proposed energy storage system, which included inverters, transformers, and cooling equipment. Importantly, our findings indicated the project would comply with the applicable noise regulations. Our team also provided live expert testimony before the North Dakota Public Service Commission regarding RSG’s noise analysis of the project.

Corridor Management Plan for Mount Rainier National Park

A Pacific Northwest icon, Mount Rainier National Park (MORA) is popular, attracting millions of visitors. However, its popularity has degraded park resources and increased traffic in and through gateway communities. This, in turn, has hurt visitors’ experiences during peak periods. As a result, the National Park Service (NPS) sought to develop a corridor management plan for MORA. The corridor management plan was innovative in that it called for both old and new data collection methods, including passively collected location-based services (LBS) data (“big data”).

To assist NPS, we collected available visitation data for MORA. This entailed finding all relevant existing NPS data sources for travel to and within MORA. Then, we developed a custom data collection and analysis plan for the project that included using LBS data to confirm or update NPS assumptions about visitor travel to and through MORA and understand visitor travel patterns and correlations between these and other visitation factors. RSG used big data insights to process the LBS data for the study area. A project-specific big data processing workflow and device-quality filtering algorithm classified devices as bronze, silver, and gold. We then checked NPS assumptions against our big data findings by comparing these to existing park data sources.

RSG used its findings to deliver custom data insights for the project area. These insights, organized by topic area, covered visitors’ home locations and travel patterns en route to and in the park. NPS used our findings to inform strategy. This, in turn, will help improve park visitor experiences, visitor access, and operational efficiencies along travel routes. Most importantly, this project validated the suitability of using big data for other NPS planning and management applications, serving as a proof-of-concept study for big data analyses to support regional planning or corridor-level efforts.

Benefit-Cost Analysis Tool Development, Optimization, and Refinement

Since 2012, RSG has served as an on-call contractor for maintaining and enhancing the San Diego Association of Government’s (SANDAG’s) activity-based model. As part of these enhancements, SANDAG wanted to build a benefit-cost analysis (BCA) tool. The BCA tool would allow SANDAG to conduct a structured evaluation of transportation investment alternatives in the region. It would do this using outputs from their activity-based model, thereby lessening aggregation biases.

The BCA tool RSG developed incorporated several sources of benefits/costs. It also used detailed outputs from SANDAG’s activity-based travel demand model. This built on foundational work in the field. SANDAG’s model outputs (trip lists) were maintained in a SQL database. To improve the tool’s utility to SANDAG, we developed specialized SQL scripts, or code. The code tabulated changes in benefits relative to the reference point, applying standard benefit-cost calculations to the model outputs. It then summarized calculations across different market segments based on SANDAG’s interests. As a result, SANDAG could evaluate outputs across different income categories based on equity and environmental justice considerations.

SANDAG’s BCA tool, which is still in use by the agency, has facilitated side-by-side comparisons of different benefits across multiple scenarios and projects. Further enhancements to the BCA tool integrated it with SANDAG’s activity-based model. RSG also optimized it (to improve run times) and performed methodological enhancements. The SANDAG BCA tool was the basis for work on the BCA4ABM tool we developed for the Federal Highway Administration. Oregon Metro then later used BCA4ABM to develop its Multi-Criteria Evaluation (MCE) toolkit.

Benefit-Cost Analysis Using Activity-Based Models

Public agencies require accurate information about future scenarios to make informed policy choices. Determining what policies to support or investments to make is complicated. Traditional benefit-cost analysis (BCA) tools get at the economic impact of these decisions. However, when a BCA is based on aggregate trip models, it can result in aggregation bias, or the incorrect assumption that all members of a group share certain characteristics. BCAs conducted using activity-based models overcome aggregation bias and can include a wider range of population characteristics in the analysis. This is because activity-based models function at the disaggregate level of individual persons and households. As a result, they can potentially be used to provide better estimates of differences in consumer welfare as it relates to policy and investment alternatives.

RSG led a project for the Federal Highway Administration (FHWA) to enhance existing BCA tools developed for regional activity-based models. Our research produced “BCA4ABM,” an open-source platform hosted on GitHub. Implemented in the ActivitySim framework, BCA4ABM can be used by participating public agencies and can be readily adapted for use by other agencies. As a general framework for calculating benefits, it works with several data types as inputs. This tool was tested for the San Diego (CA) and Tampa (FL) regions. It has since been applied in other regions, including Portland (OR). The tool can also be used with traditional trip-based models.

Implementing the National Intercity Bus Atlas

The American intercity bus industry is poorly understood and underappreciated. Unlike the air, auto, and rail industries, a federal agency to represent the bus industry does not exist. Congress also left the bus industry out of relief passed at the outset of the COVID-19 pandemic. Moreover, the current intercity bus market is one in which carriers often view their service data as proprietary. The result is a fractured and limited picture of bus service across the United States.

The National Academies of Sciences, Engineering, and Medicine selected a team led by RSG to implement a national intercity bus atlas. This atlas will create a centralized repository of intercity bus routes and services. It will build on work started in 2019 by the Bureau of Transportation Statistics (BTS), which began an Intercity Bus Atlas (ICBA) initiative. The scope of the ICBA is to collect, compile, publish, and archive scheduled intercity bus service information; the ICBA does this using General Transit Feed Specification (GTFS) data. RSG will work closely with BTS and the Federal Geographic Data Committee Intercity Bus Working Group. A crucial element of this work will be relational. Success will hinge on the effective engagement of bus carriers to demonstrate the value to them in sharing their service data.

The project will create a flexible system with supportive tools. This will enable intercity bus companies to easily compile and upload their service data in GTFS format. This data will help close any information gaps about intercity bus services. It will also demonstrate how important the intercity network is to millions of riders every year. The tool will also offer the broader context and situational awareness sought by policymakers. The result will help them make informed funding, policy, and operational decisions about bus service at the local, state, and regional levels.

Big Data Origin-Destination Study in California

The California Department of Transportation (Caltrans) District 9 has conducted an origin-destination study in the region roughly every 10 years since 1979. Each origin-destination study furthers Caltrans' understanding of how visitors use District 9’s highways. However, despite the studies' importance, the intercept surveys had been constrained by the previous data collection method. This method used a small data source paired with several assumptions and required intrusive traffic stops. This resulted in a labor-intensive survey process; it did not fully capture the breadth of information on travelers in the region.

In search of newer methods, Caltrans turned to RSG and our passive mobility data analytics services to produce a dataset that is comparable in utility to, but more cost-effective than, past survey methods. To ensure comparability with past surveys, we paired the big data we gathered with a small online survey. The big data and survey data were from the winter and summer months of 2019 and 2020. The survey delivered additional information from respondents and provided greater confidence in the validity of the big data results. Our findings are assisting Caltrans District 9 planning staff with predicting traffic and economic changes in the region. District 9 and local agencies will also use the results from our work to develop strategies and recommendations.

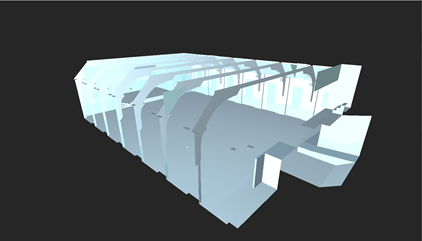
Auditorium Acoustical Renovation

The City of St. Albans, Vermont, has a multipurpose room in City Hall that is used for dances, sports, auctions, fitness classes, meetings, and more. The City expressed several concerns with the acoustical space, including inadequate speech intelligibility and lack of clarity in music performances. RSG assisted the City with improving the clarity of both speech and music as part of planned renovations. Our analysis of the space found that the measured reverberation time was nearly three seconds long in the speech frequency range, which explained the concerns regarding inadequate speech intelligibility.

To explore renovation options with the City, we conducted three-dimensional computer modeling of the space to evaluate several acoustical metrics against recommended performance parameters. The model was also used to develop auralizations, which are simulations of what the space would sound like after different renovation options. These simulations allowed the project team and City representatives to listen to the differences in the options prior to construction. They also allowed for a tangible cost-benefit analysis of the various renovation options. As a result of our analysis and recommendations, the reverberation time was brought down to 1.4 seconds and the clarity of the space was notably improved.

Wind Farm Noise Impact Assessment

National Grid Renewables developed Crocker Wind Farm, a 200-megawatt wind energy project located in Clark County, South Dakota. To prepare the project for permitting, RSG was hired to conduct a noise compliance assessment. The assessment included preconstruction background sound-level measurements over a one-week period, sound-propagation modeling of several turbine models, and development of noise mitigation for each option. The project was designed to comply with the county noise limits and the state permit limits. RSG provided expert testimony before the South Dakota Public Utilities Commission regarding the noise assessment. Since the project was found to meet the state requirements, including the applicable noise limits, the Public Utilities Commission approved the project and issued a permit. The project was constructed and began operating in December 2019.

Special thanks to National Grid Renewables for the featured wind turbine image.

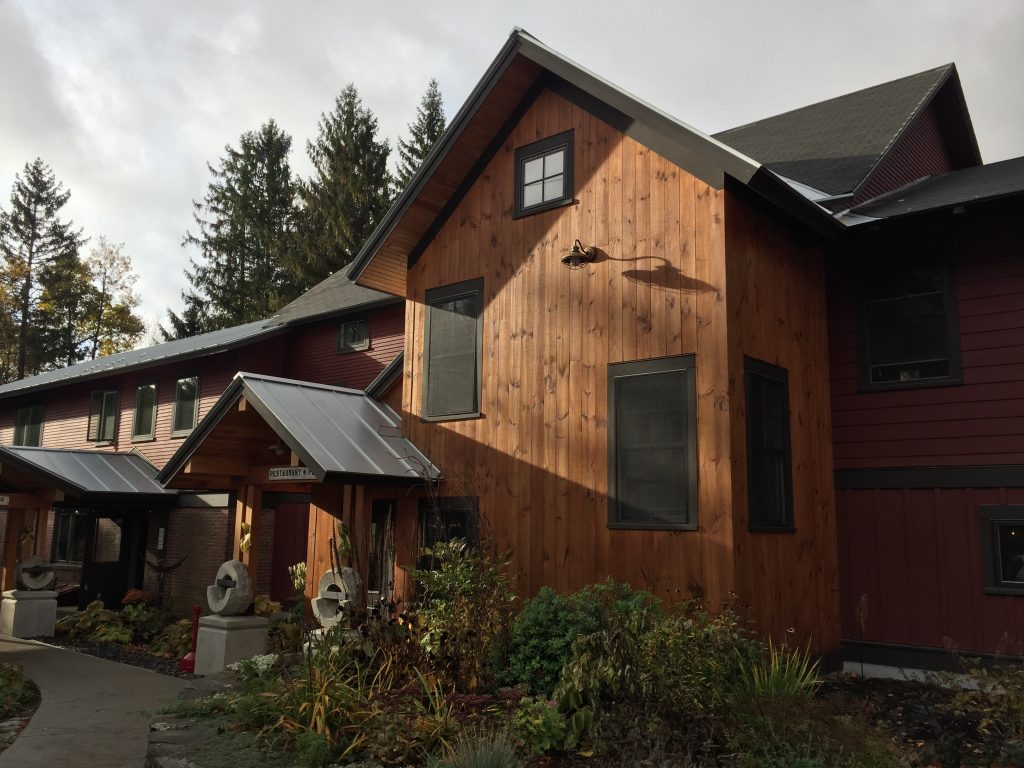
Community Noise Mitigation Planning for a Wedding Venue

The Mad River Barn Inn & Restaurant, which is in a scenic area of the Green Mountains in Vermont, hosts several outdoor weddings each year. The weddings had been hosted under a tent canopy, but the venue was looking to develop a more permanent structure. The proposed pavilion would be partially open to the outdoors and required an Act 250 land-use development permit from the state. RSG conducted a noise assessment of the proposed facility and developed mitigation measures to help the proposed pavilion reduce sound levels when compared to events previously held under the tent canopy. The mitigation included acoustical specifications for the pavilion walls, operable transparent vinyl side panels, and a house sound system with a limiter. Due to the lower sound levels, the Commission allowed for an increase in the number of events that could be held at the facility each year as requested by the venue owners. Upon completion of the pavilion, we conducted postconstruction measurements. These measurements confirmed that—with the house sound system at maximum volume—sound levels at nearby residences were below the permitted limit.

Hospital Boiler Room Noise Mitigation & Compliance Assessment

A hospital was applying for a state permit to replace their existing boilers and asked RSG to conduct a noise assessment of the proposed changes. The assessment was triggered by state noise requirements and the hospital’s understanding of noise concerns within the neighboring residential area. In response, we measured sound levels of the equipment associated with the existing boiler room and adjacent to the community. These measurements were used to quantify existing sound levels and provide input into a sound-propagation model. We then conducted sound-propagation modeling for an existing and proposed scenario. The study found that the change in sound levels from the boiler room would be 2 dB or less. This meant that projected sound levels would be below the existing background sound levels in the neighborhood. We also developed a mitigation plan to reduce the sound emissions from the boiler room, including acoustical louvers (sound-reducing structures/vents) in the exterior wall that allowed for ventilation at a reduced sound level.

The hospital received their permit and installed the boilers. Once construction was complete, RSG conducted postconstruction sound measurements to assess the effectiveness of the implemented mitigation measures. The boilers were operated through their full capacities, but background sound levels were higher than the sound emissions from the boiler room and were indistinguishable. Given that, we used an acoustic camera (an imaging device for sound) to determine the amount of sound emanating from various building components. Doing so allowed us to confirm that the installed mitigation measures were effective.