

The pandemic reshaped how and when people travel, challenging long-standing assumptions in travel demand modeling. For example, more flexible, dispersed travel throughout the day has replaced traditional commute patterns. At the same time, transit agencies and transportation planners must navigate changing ridership levels while ensuring their systems continue to serve those who rely on them. These shifts raise several critical questions. How should agencies reflect these changes in their forecasting tools? And how can they build flexibility into these tools?
To address these questions, agencies should consider adopting a data-driven approach by leveraging travel surveys, passively collected data, and observed counts to ensure their models align with actual travel patterns. This article explores how commuting trends, peak-hour demand, and nonmandatory travel have evolved, the impact on congestion and transit planning, and strategies for integrating new data sources into agency models. By embracing a data-driven modeling approach that can be updated more frequently, agencies can ensure that their planning, policy, and investment decisions reflect current travel behaviors.
A Changing Travel Landscape is Increasing the Need for More Frequent Model Updates
Historically, work-related transit trips followed predictable patterns, occurring at the same time and on the same days each week. This consistency made it relatively easy for commuters and transit agencies to plan routes and schedules. However, despite many workers returning to offices, there are still fewer people commuting to offices daily than before the pandemic. Moreover, transit ridership has dropped in many regions, forcing agencies to rethink service planning.
It is unclear what percentage of people will return to full-time in-office work, five days per week. Adding to this challenge is uncertainty about long-term commuting trends. Many workers have returned to the office, while others have embraced hybrid work or work-from-home permanently. When recalibrating models with data collected after the pandemic, we reflect the postpandemic travel behaviors, including work tours (or not making work tours) and changes to nonmandatory work tours. As shown in the chart below, the 2018 Travel Behavior Inventory data collected by RSG for the Metropolitan Council in Minnesota showed that almost 70% of full-time workers went to work (mandatory tour days), compared to just over 40% in 2021. However, the percentage of full-time workers staying home only increased by 4% (from 8% in 2018 to 12% in 2021).
In some cases, we have included an adjustment factor to shift the work travel behaviors in the model from postpandemic to prepandemic conditions. Agencies can use this factor to test scenarios where all or a portion of workers will return to prepandemic commuting patterns.
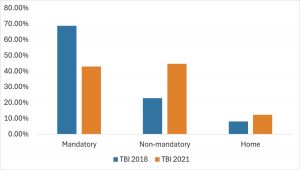
This chart compares the daily activity pattern of full-time workers in 2018 (blue) and 2021 (orange). M days indicate that a worker made a work tour on the survey day, N indicates that the worker made at least one nonmandatory tour on the survey day, and H indicates that the worker either stayed home or was out of the region on the survey day. These data were collected through surveys conducted by RSG for the Metropolitan Council in Minnesota.
With the evolution of worker travel patterns, along with many other evolving transportation trends, models need to be updated frequently with readily available data and need to remain flexible to accommodate the impact of a wide range of scenarios. Gone are the days when we relied on the decennial census to reveal travel trends and update our models on a 10-year cycle.
Failing to consider the scale and speed of these changes comes with risks. Infrastructure investments, from highway expansions to transit projects, must align with how people travel. When agencies continue to rely on outdated model assumptions, they risk mismatching funds with future demand and impacting both personal mobility and transportation system efficiency.
Smarter Data Collection Can Improve Model Accuracy
While passively collected data sources, such as GPS and location-based services, offer valuable insights, they are not sufficient to support travel demand model validation. These datasets can help refine trip rates and distributions, but they lack key details such as mode choice and trip purpose.
To build more useful models, agencies should supplement passively collected data with high-quality survey data. Surveys conducted using rMove® capture crucial information that passively collected data alone cannot provide, enabling agencies to make more accurate, data-driven decisions. When used in tandem, passively collected data can inform survey design, while survey data can enhance the interpretation of passively collected datasets. However, agencies should avoid overrelying on passively collected data without proper validation, ensuring that travel demand models maintain a high level of accuracy for forecasting purposes.
The Metropolitan Council has adopted a proactive approach to tracking evolving travel behaviors by conducting household travel surveys every two years as part of its Travel Behavior Inventory. This effort provides a valuable case study of how agencies can leverage recurring surveys to monitor long-term shifts. By comparing prepandemic (2018) and postpandemic (2021) survey data, the Council identified key trends, including a significant increase in telecommuting, a shift from mandatory work trips to more discretionary travel, and changes in trip timing, with work departures occurring later in the day. These findings illustrate the importance of updating models frequently to capture emerging patterns rather than relying on assumptions from past decades.
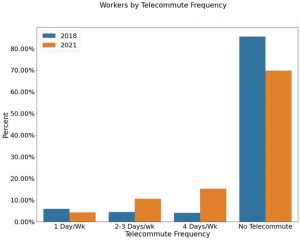
Changes in telecommuting frequency between 2018 and 2021 highlight a significant shift in work patterns. While the share of workers who never telecommuted declined, those working remotely multiple days per week increased. This shift underscores the need for travel demand models to account for evolving commute behaviors, as traditional peak-hour patterns become less pronounced. These data were collected through surveys conducted by RSG for the Metropolitan Council in Minnesota.
For MPOs seeking to refine their models in the near term, engaging with state DOTs can be a crucial first step to ascertain the possibility of coordination or resource pooling. More agencies now adopt recurrent survey approaches, in which they gather smaller amounts of data every few years instead of relying on large, one-time surveys. For example, the Metropolitan Council’s biennial survey ensures data remains current, while the Ohio Department of Transportation has followed a rotating schedule for the past decade, surveying different regions over a 9-year cycle. This approach distributes costs and ensures data remains current.
Maintaining a strong traffic count program is also essential. One of the most common uses of a travel model is forecasting future-year traffic, and counts are an integral part of validating a model. If a model cannot adequately reflect travel behavior, it presents a fundamental issue for forecasting. Having access to up-to-date traffic data, along with survey data, provides a solid foundation for model improvements.
Changing Activity Patterns Are Reshaping Peak Demand
Travel surveys conducted by RSG and our clients have shown a pronounced change among full-time workers, with part-time workers experiencing smaller shifts. For nonworkers, there has been a notable increase in the number of trips they make daily. Meanwhile, retired individuals and K–12 students have maintained similar travel patterns.
One emerging trend is a shift in trip departure times. Previously, commuters packed rush hour between 7:00–9:00 a.m. and 4:00–6:00 p.m. However, data from travel surveys conducted by RSG in Minnesota indicate that work trips are now occurring slightly later in the day, likely due to more flexible work schedules. This results in less pronounced peak period congestion and affords agencies greater flexibility when determining how to address the effects of congestion.
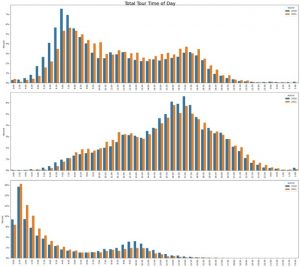
This visualization compares the timing of trips in 2018 (blue) and 2021 (orange), showing tour departures, arrivals (returning home), and overall tour durations. The data indicate a shift in travel patterns, with work trips occurring later in the day and more flexibility in daily schedules. These findings, based on surveys conducted by RSG for the Metropolitan Council in Minnesota, highlight the need for updated travel models that reflect evolving commuter behaviors.
To track trends such as commuter patterns, agencies should use data such as traffic counts and transit usage. If these data indicate a significant departure from previous travel patterns, agencies must review their models to confirm they still capture travel behavior accurately. In addition, agencies can conduct smaller, more frequent travel surveys to better understand the reasons behind these shifts. For example, workers with flexible schedules may be starting their day earlier at home and then commuting to work in off-peak periods. Recent RSG surveys have also revealed variability in daily commutes where workers may go to the office two or three days a week, often avoiding Fridays.
While total traffic volumes may have returned to prepandemic levels in many communities, the distribution of trips across the day may have changed. Models that were calibrated on prepandemic conditions are unlikely to accurately account for these changes and should be updated to reflect new travel behaviors. Long-term trends remain uncertain, but current data suggests a fundamental and lasting shift in travel behavior.
Beyond pandemic-related changes, broader societal factors are also influencing travel. The widespread popularity of e-commerce and delivery services has reduced certain trip types, while continued technological advancements are reshaping work and commuting patterns. Since at least 1995, the National Household Travel Survey (NHTS) has shown a gradual decline in home-based trip rates, a trend that has likely continued, even if it has not always been immediately apparent.
Key Takeaways for Agencies Developing Travel Models
To accurately understand and forecast travel, agencies should invest in structured, ongoing data collection programs. High-quality travel surveys provide critical insights, and relying on outdated assumptions can lead to a misallocation of resources.
Agencies can adjust the structure and frequency of these programs and often pool resources to maximize the cost-effectiveness of their data collection efforts. Additionally, maintaining strong datasets on traffic counts, transit ridership, and travel times will improve model calibration and forecasting accuracy.
As the transportation landscape continues to evolve, agencies that embrace a data-driven, flexible approach will be best positioned to adapt while serving their communities. By leveraging both traditional survey data like that collected by rMove and emerging mobility sources, they can develop models that reflect the realities of a changing world, ensuring that planning, policy, and investment decisions are informed by the most reliable insights available.
····························
Ready to develop a smarter, more adaptable travel model? Let’s talk about how we can help your agency develop a flexible, accurate, and future-focused solution. Contact us to get started.
