The Florida Department of Transportation (FDOT) District Seven (D7), in cooperation with the metropolitan/transportation planning organizations (MPOs/TPOs) in Hernando/Citrus, Hillsborough, Pasco, and Pinellas counties, innovatively combined proven market research techniques with mobility data analytics to gain deeper insights into the Tampa Bay region’s travel patterns.
Work began in 2018 at the outset of their five-year survey program, known as the Tampa Bay Regional Travel Surveys. Through this survey, FDOT D7 sought to update the Tampa Bay Regional Planning Model (TBRPM), and regional long-range transportation plans, among other planning initiatives.
This effort culminated in the completion of the Tampa Bay Regional Travel Survey Augment in 2023, which merged advanced mobility data analytics techniques with self-reported smartphone survey data collected during the Tampa Bay Regional Travel Survey, visitor surveys, and employer-employee surveys. Findings of travel behaviors before and after the pandemic provided planners with a detailed and more accurate picture of the region’s mobility trends.
The Challenge
FDOT D7 wanted to update its transportation models and plans in response to shifting travel behaviors amid the region’s growing population, diversifying demographics, and evolving mobility demands. To accomplish this, the region’s transportation planners needed a better way to understand the long-term impacts of these shifts on travel demand and infrastructure needs.
Considerations included finite resources and an organizational mission to support equitable, sustainable, and multimodal transportation solutions for the region’s residents. Moreover, the region’s large population of seasonal residents, tourists, and special generator attractions like beaches and theme parks meant residential address-based travel surveys alone were insufficient at delivering a complete picture of visitor travel behavior.
The COVID-19 pandemic added to these complexities, giving less explanatory power to some prepandemic data FDOT D7 had collected between October 2018 and April 2019 and necessitating a reevaluation of travel habit shifts and their long-term implications on travel demand and infrastructure. The use of big data sources, while promising for capturing real-time travel patterns, presented hurdles. These included issues with data accuracy, privacy, and integration with traditional survey methods. FDOT D7 sought RSG’s expertise in travel surveys and mobility data analytics to help their team bridge traditional survey insights with emerging patterns identified through big data.
RSG’s Solution
RSG evaluated multiple potential data products for the study to determine their strengths, limitations, and whether they could reliably answer FDOT D7’s questions around visitor—as well as resident and worker—travel patterns and demographics. RSG determined that a combination of data products could leverage the collective benefits of these data sources while filling in the individual gaps.
Our team then began work with FDOT D7 to develop a transparent and methodologically sound framework that combined traditional travel survey data collected using rMove® with data from Replica and other location-based services (LBS) data sources. This approach sought to update the region’s transportation models and plans to better reflect current and future mobility needs. For instance, big data sources can help strengthen the utility of survey data by providing a cost-effective means of better understanding the spatial distribution of trips.
RSG collected and assessed the data on personal and vehicle trips within and through the D7 area. Data from the various sources were analyzed, presented, and compared to identify and quantify travel demand, origin-destination patterns, home and work locations, and the travel and demographic characteristics of person and vehicle travelers.
A significant focus was placed on visitor travel, leveraging both traditional survey techniques and passively collected mobility data sources to overcome the limitations of low survey response rates from tourists. This was an important consideration for FDOT D7 as visitor travel comprises a significant percentage of Florida transportation system use. This holistic data collection and analysis effort enabled our team to present a detailed picture of travel patterns, contributing to a dynamic, interactive picture of travel in the region.
For the Tampa Bay Regional Travel Survey Augment portion of our work, RSG primarily relied on spatial methods, identifying 10 points of interest with high visitation levels when compared to the five-county FDOT D7 study area. This process helped ensure the capture of data associated with visitors to the region. Using data from Replica, LBS sources, and rMove, our team completed a thorough evaluation of travel patterns and delivered a better snapshot of not only visitor travel, but all travel within, to, from, and through the Tampa Bay Region for an updated fall 2022 baseline condition. The combination of data sources employed by the project team allowed us to leverage the benefits of all data sources while reducing the limitations of individual sources.
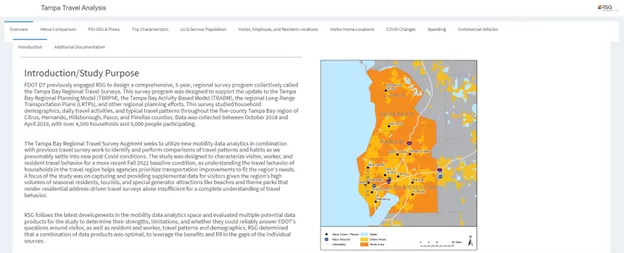
The RSG team’s innovative use of an online, interactive storyboard (pictured below) to present the findings addressed the challenge of making the study’s voluminous data accessible and understandable to stakeholder audiences. This digital platform also allowed stakeholders to explore travel behavior data through dynamic figures, charts, and tables, organized around key travel behavior questions. The development of analytical programming code facilitated this process, with the codebase hosted on GitHub for transparency and collaboration.
Our team’s augmented mobility data analytics approach provided FDOT D7 with comprehensive insights into regional travel behaviors, highlighting significant shifts post-pandemic, such as changes in downtown activity levels, public transit ridership, and work-from-home trends. These findings have been instrumental for FDOT D7 and local policymakers in making informed decisions on transportation planning and policy, ensuring their regional transportation network continues to evolve to meet the needs of a growing and diversifying population.