

It is a familiar sight to travelers near tourist and recreation destinations: A line of cars snaked down the roadway as traffic grinds to a halt. In most cases, the congestion is due to a destination’s popularity. In other cases, construction is the cause.
But during a few months in 2011, 2000, and 1989, stopped vehicles seen along the US 395 corridor in Inyo and Mono counties in California were encountering neither roadwork nor traffic. Instead, these vehicles were being interviewed by survey personnel performing a “traveler census” for the California Department of Transportation (Caltrans) District 9.
Officially called the “Origin and Destination (O&D) Study,” the survey has been conducted by Caltrans roughly every 10 years since 1979. The purpose of the survey effort has been to facilitate transportation planning and economic analysis in the region. However, despite its importance to understanding how visitors use District 9’s highways, intercept surveys are constrained by a data collection method that—in addition to requiring intrusive traffic stops—used a small data source paired with several assumptions.
In search of newer methods, Caltrans recently turned to RSG and our passive mobility data analytics services to produce a dataset that is comparable in utility to, but more cost-effective than, past survey methods. The results of this first-of-its-kind survey in California have demonstrated the incredible promise of big data in the context of predicting traffic and economic changes at a regional level.
Big data delivers information at a previously unimaginable scale and at a lower cost than traditional counts and surveys
Big data on the movement of persons and vehicles is a valuable and powerful source of data for travel modeling and forecasting. It includes information from observations of millions of individual trips and can help planners understand travel patterns in a region or how people circulate through a region daily.
Survey data typically contains observations for 2% or less of the cells in an O&D matrix. In contrast, when using big data, it is now possible to observe the movements of over 15% of the population over any given month. This scale can support analyses that are impossible using the small samples manual surveys collect.

Moreover, big data excels when it comes to continuity, covering entire weeks and months, 24 hours a day, and irrespective of weather or sunrise and sunset times. It captures travel on all roads, not just key arterials, and can provide more accurate and precise information on travelers’ activities in the region.
In terms of cost, big data also excels when compared to traditional survey methods. In the case of methods like those RSG employed as part of the decennial Caltrans District 9 O&D Study, big data negates the need to deploy, monitor, or maintain in-field survey equipment. This means that larger samples do not equate with larger costs; instead, most of the cost of using big data comes from the cleaning, processing, and expansion methods employed.
Big data is paired with a small online survey to ensure accurate results and comparability with past surveys
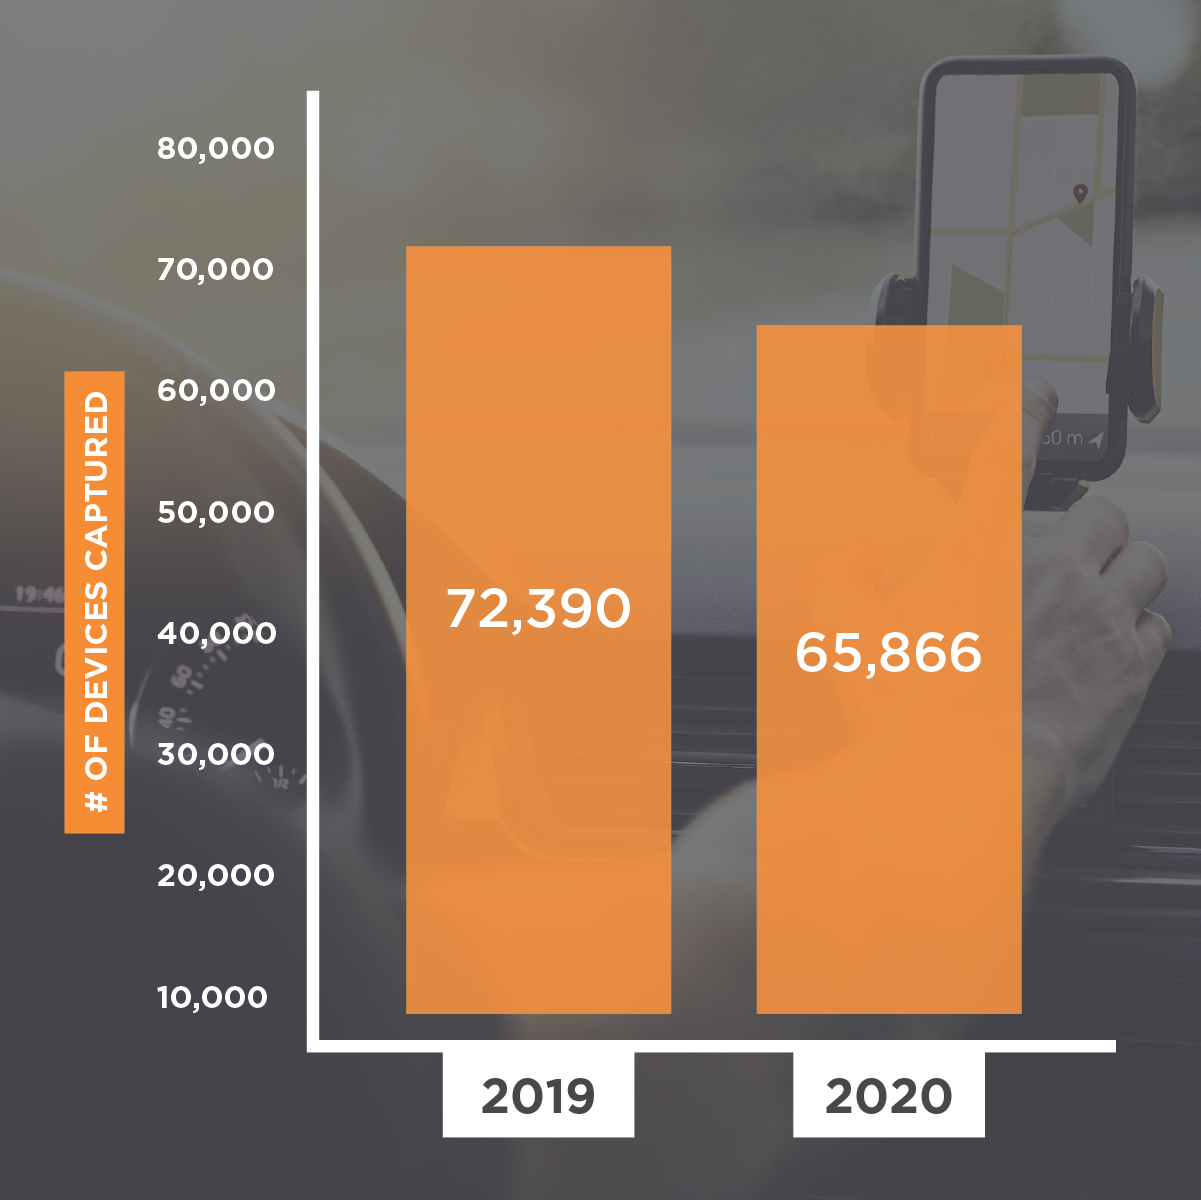
The big data used in the Caltrans District 9 O&D Study was collected in the winter and summer months of 2019 and 2020. A total of 72,390 devices were captured during the 2019 periods, while the 2020 periods captured 65,866 devices. An online travel survey administered to residents and visitors to Mono and Inyo counties between August and October 2020 received 403 responses.
The online travel survey fulfilled two important functions. First, it delivered additional information from respondents such as vehicle occupancy, whether this is the first time visiting the region, and other valuable information that has been collected in the previous surveys but cannot be derived from big data alone. Second, pairing big data with an online survey provided greater confidence in the validity of the big data results and comparability with previous surveys. In short, the survey data validated and enhanced big data.
Selecting the right type of big data to use for the project necessitated evaluating the strengths and weaknesses of currently commercially available big data sources. Most of these sources rely on data from cellular, Global Positioning System (GPS), location-based service (LBS), or smartphone travel survey data. RSG chose LBS data as the primary data source for this study since it provides the best combination of desirable characteristics for travel analysis. It also provided the correct balance of sample size and spatial precision for this study.
Big data requires filtering, processing, expansion, and validation before it can help create useful O&D matrices
Big data’s utility in the transportation planning context stems in large part from the work that goes into ensuring it is representative of travel as a whole. This requires extensive exploratory analysis to understand noise in the data. Once understood, advanced algorithms and processes—many of which RSG routinely employs on projects—help to filter, process, expand, and then validate the data for use in the final O&D trip matrices.
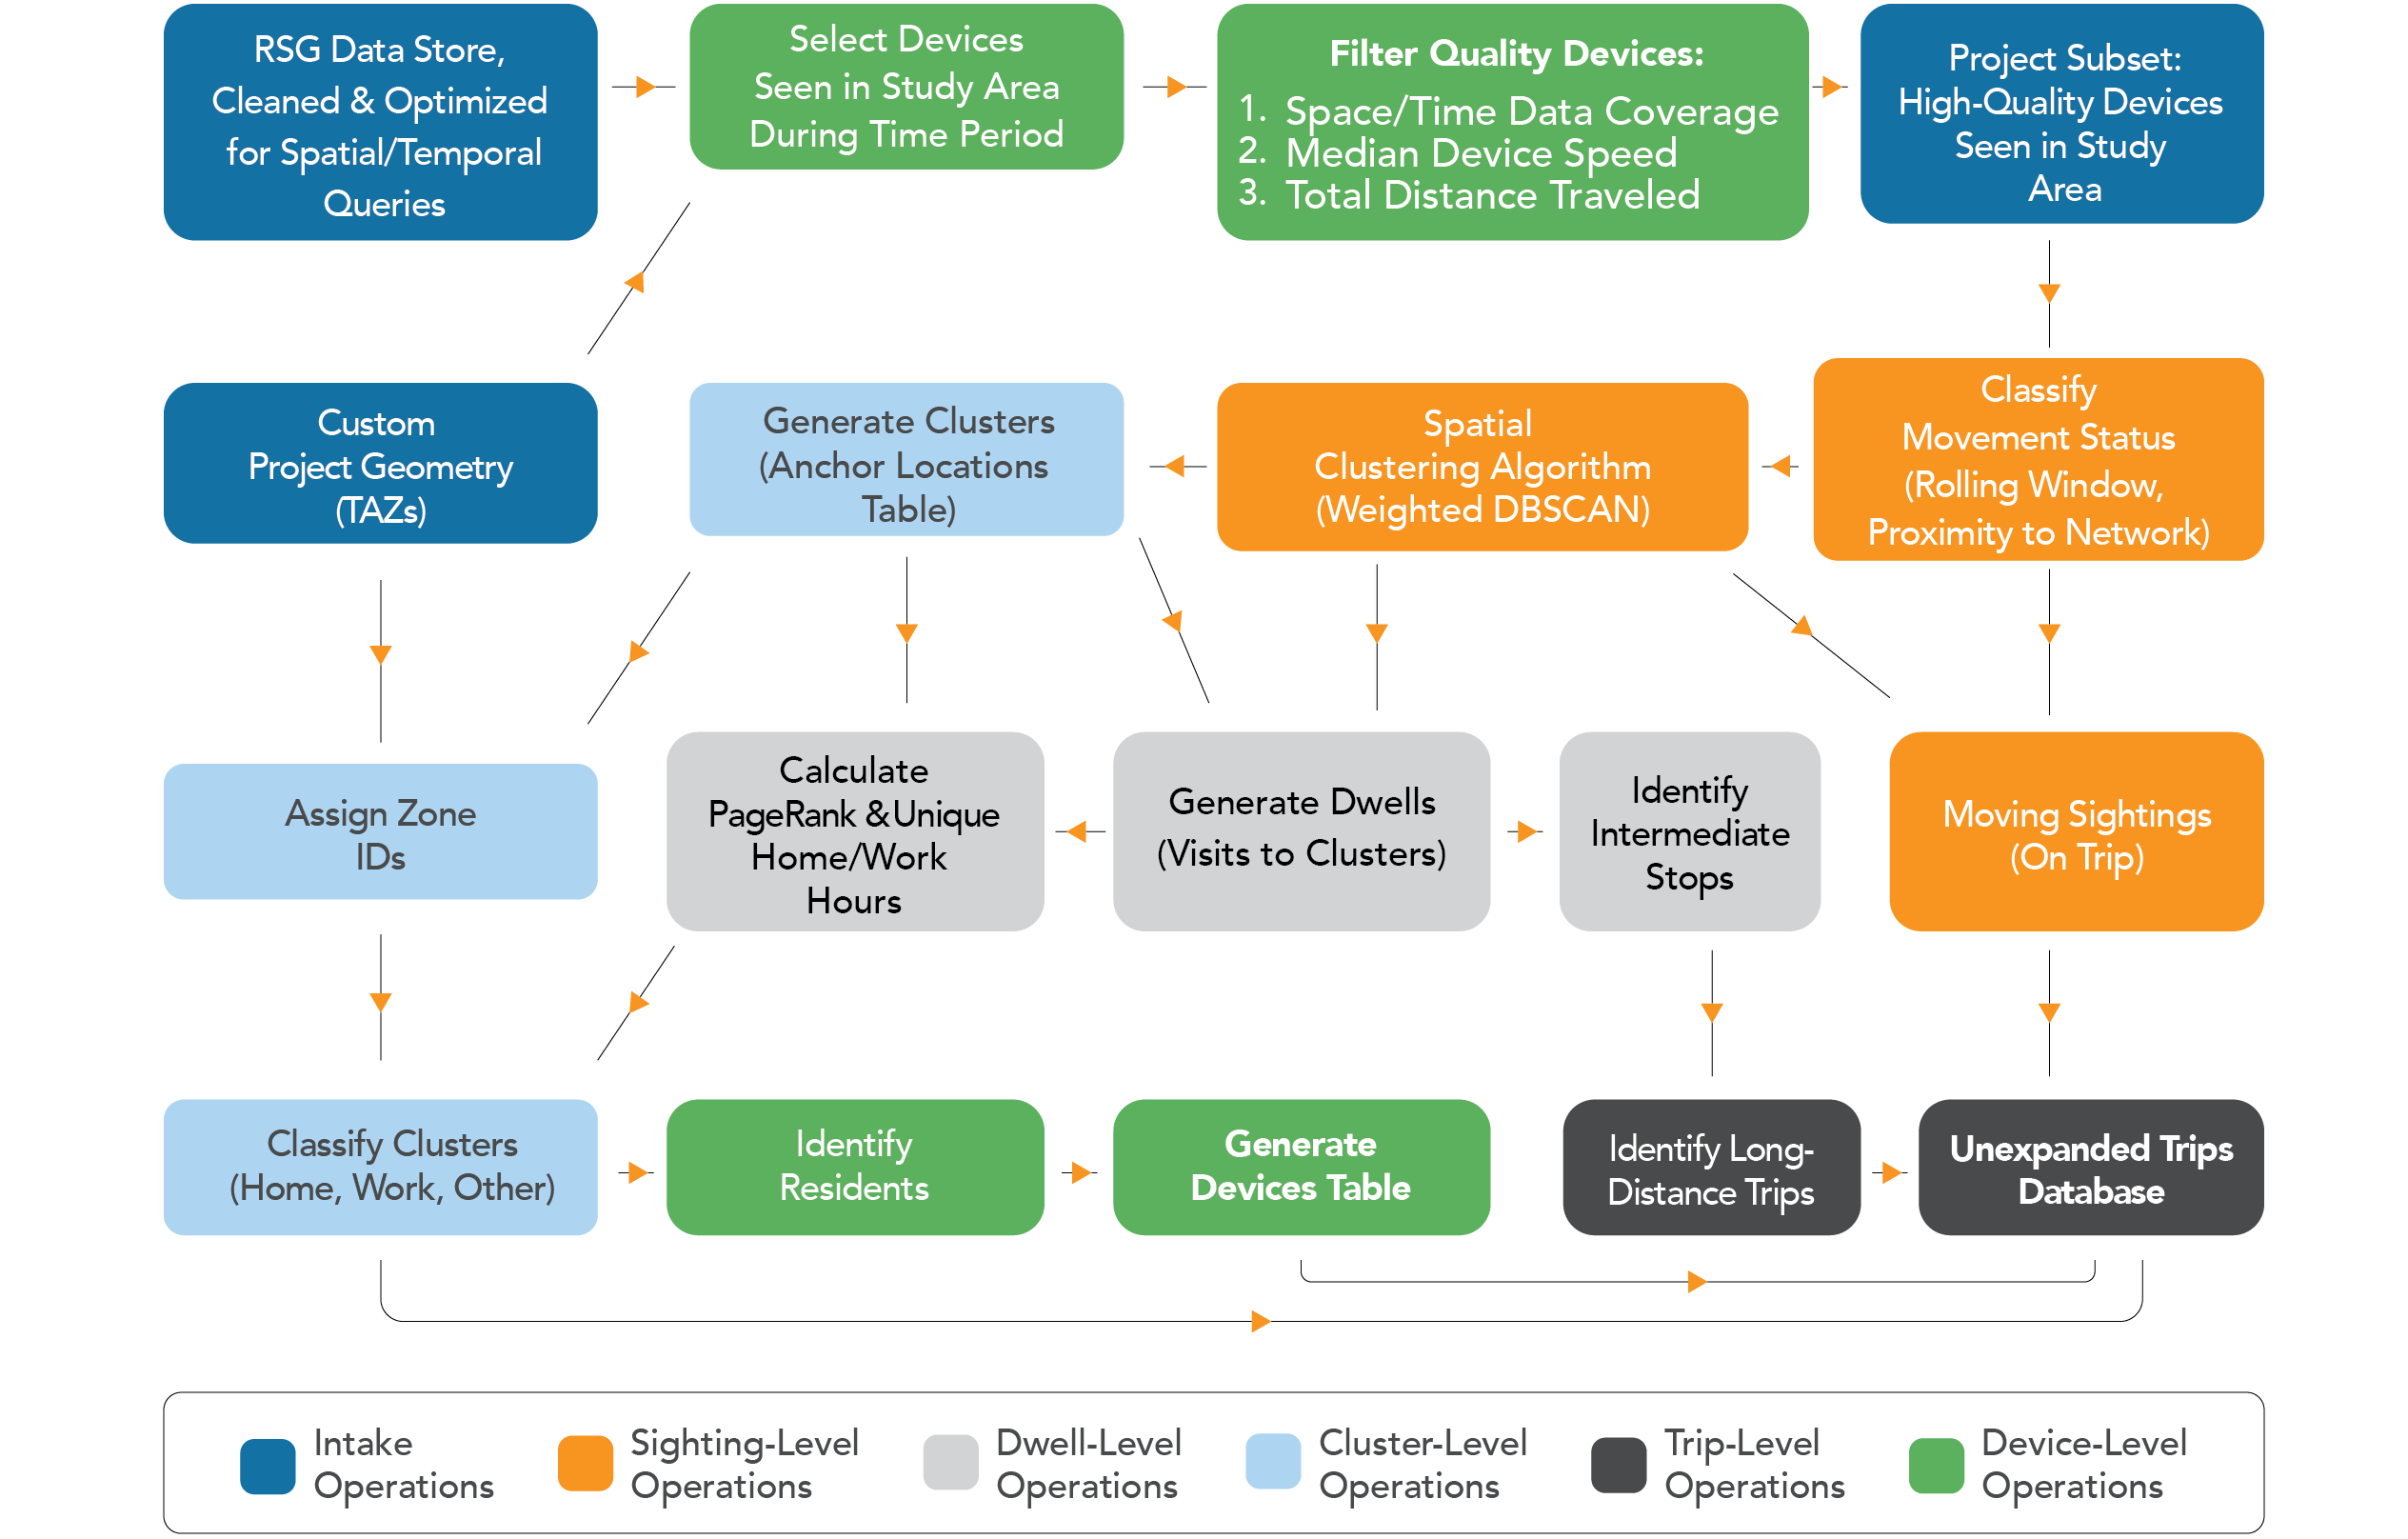
The LBS data processing procedure is depicted here. The data used in this procedure has no trip characteristics beyond spatial location and time. As a result, many key trip attributes—such as movement, stops, home location, and work location—must be inferred to produce an unexpanded trips database.
The Caltrans District 9 O&D big data was filtered, which is the process of selecting data that is both relevant and of sufficient quality to be useful in the study’s analysis. Also called an “ingest” procedure, the big data was enriched using OpenStreetMap and census identifiers. Filtering leaves only the most relevant device sightings. Relevance is important as LBS datasets include device sightings for hundreds of millions of devices. Low-quality devices, such as those with unreasonable speeds or long gaps between sightings, were removed during this step.
After filtering, the big data was processed. This involved identifying trips from the raw coordinate-timestamp data based on a two-step process. In the first step, individual sightings are classified as in motion based on the speed computed over a rolling time window. In the second step, a weighted spatial clustering algorithm is applied on all stopped sightings to identify locations where a device frequently stops. A smoothing algorithm, used to classify device movement status, helps filter out stops due to traffic signals or congestion.
Once the Caltrans District 9 O&D Study big data was filtered and processed, it still required expansion before being used in O&D trip matrices. While big data provides a much larger sample than surveys, it still represents only a fraction of all travelers and trips. Moreover, it is not a controlled random sample but rather a convenience sample, which means it is not always representative. Expansion methods correct for known biases and ensure the final expanded data product is representative of all travel. The Caltrans District 9 O&D Study used an ensemble expansion method. This means the ultimate expansion factors are developed as a product of several component expansion factors—not just one.
As part of the final step, the Caltrans District 9 O&D Study big data underwent two rounds of validation. A first round of processing validation checks helped eliminate dataset anomalies. This initial check also helped establish a baseline of the effect of data expansion. The validation confirmed that the expansion process addressed some observed biases and verified the general reasonableness of the resulting dataset. Together, these checks ensured the integrity of the raw data and its processing, and the reasonableness and effectiveness of the expansion process.
The Caltrans District 9 O&D Study demonstrated the efficacy of using big data to conduct future studies
The findings from the 2020 O&D Study are assisting Caltrans District 9 planning staff with predicting traffic and economic changes. District 9 and local agencies will also use the results from our work on the 2020 O&D Study to develop strategies and recommendations. This, in turn, will help practitioners support sustainable economic growth, forecast highway needs as the population grows, and address the environmental and social needs in the district and state.
Importantly, the Caltrans District 9 O&D Study is a proof-of-concept project that demonstrates the ability of big data, when paired with a small online survey, to replace in-field survey efforts and reduce attendant costs and complexities associated with their deployment and operations. As the breadth and quality of big data continues to improve across the industry, this type of study will become an even more attractive option for agencies looking to maximize resources while adopting advanced data science planning strategies and tools like those offered by RSG.
Click here to view the Caltrans District 9 O&D Study findings, which were presented to Mono County on December 14, 2020.