Open Source Activity-Based Model Visualization Toolkit – ABMVIZ
Atlanta Regional Commission
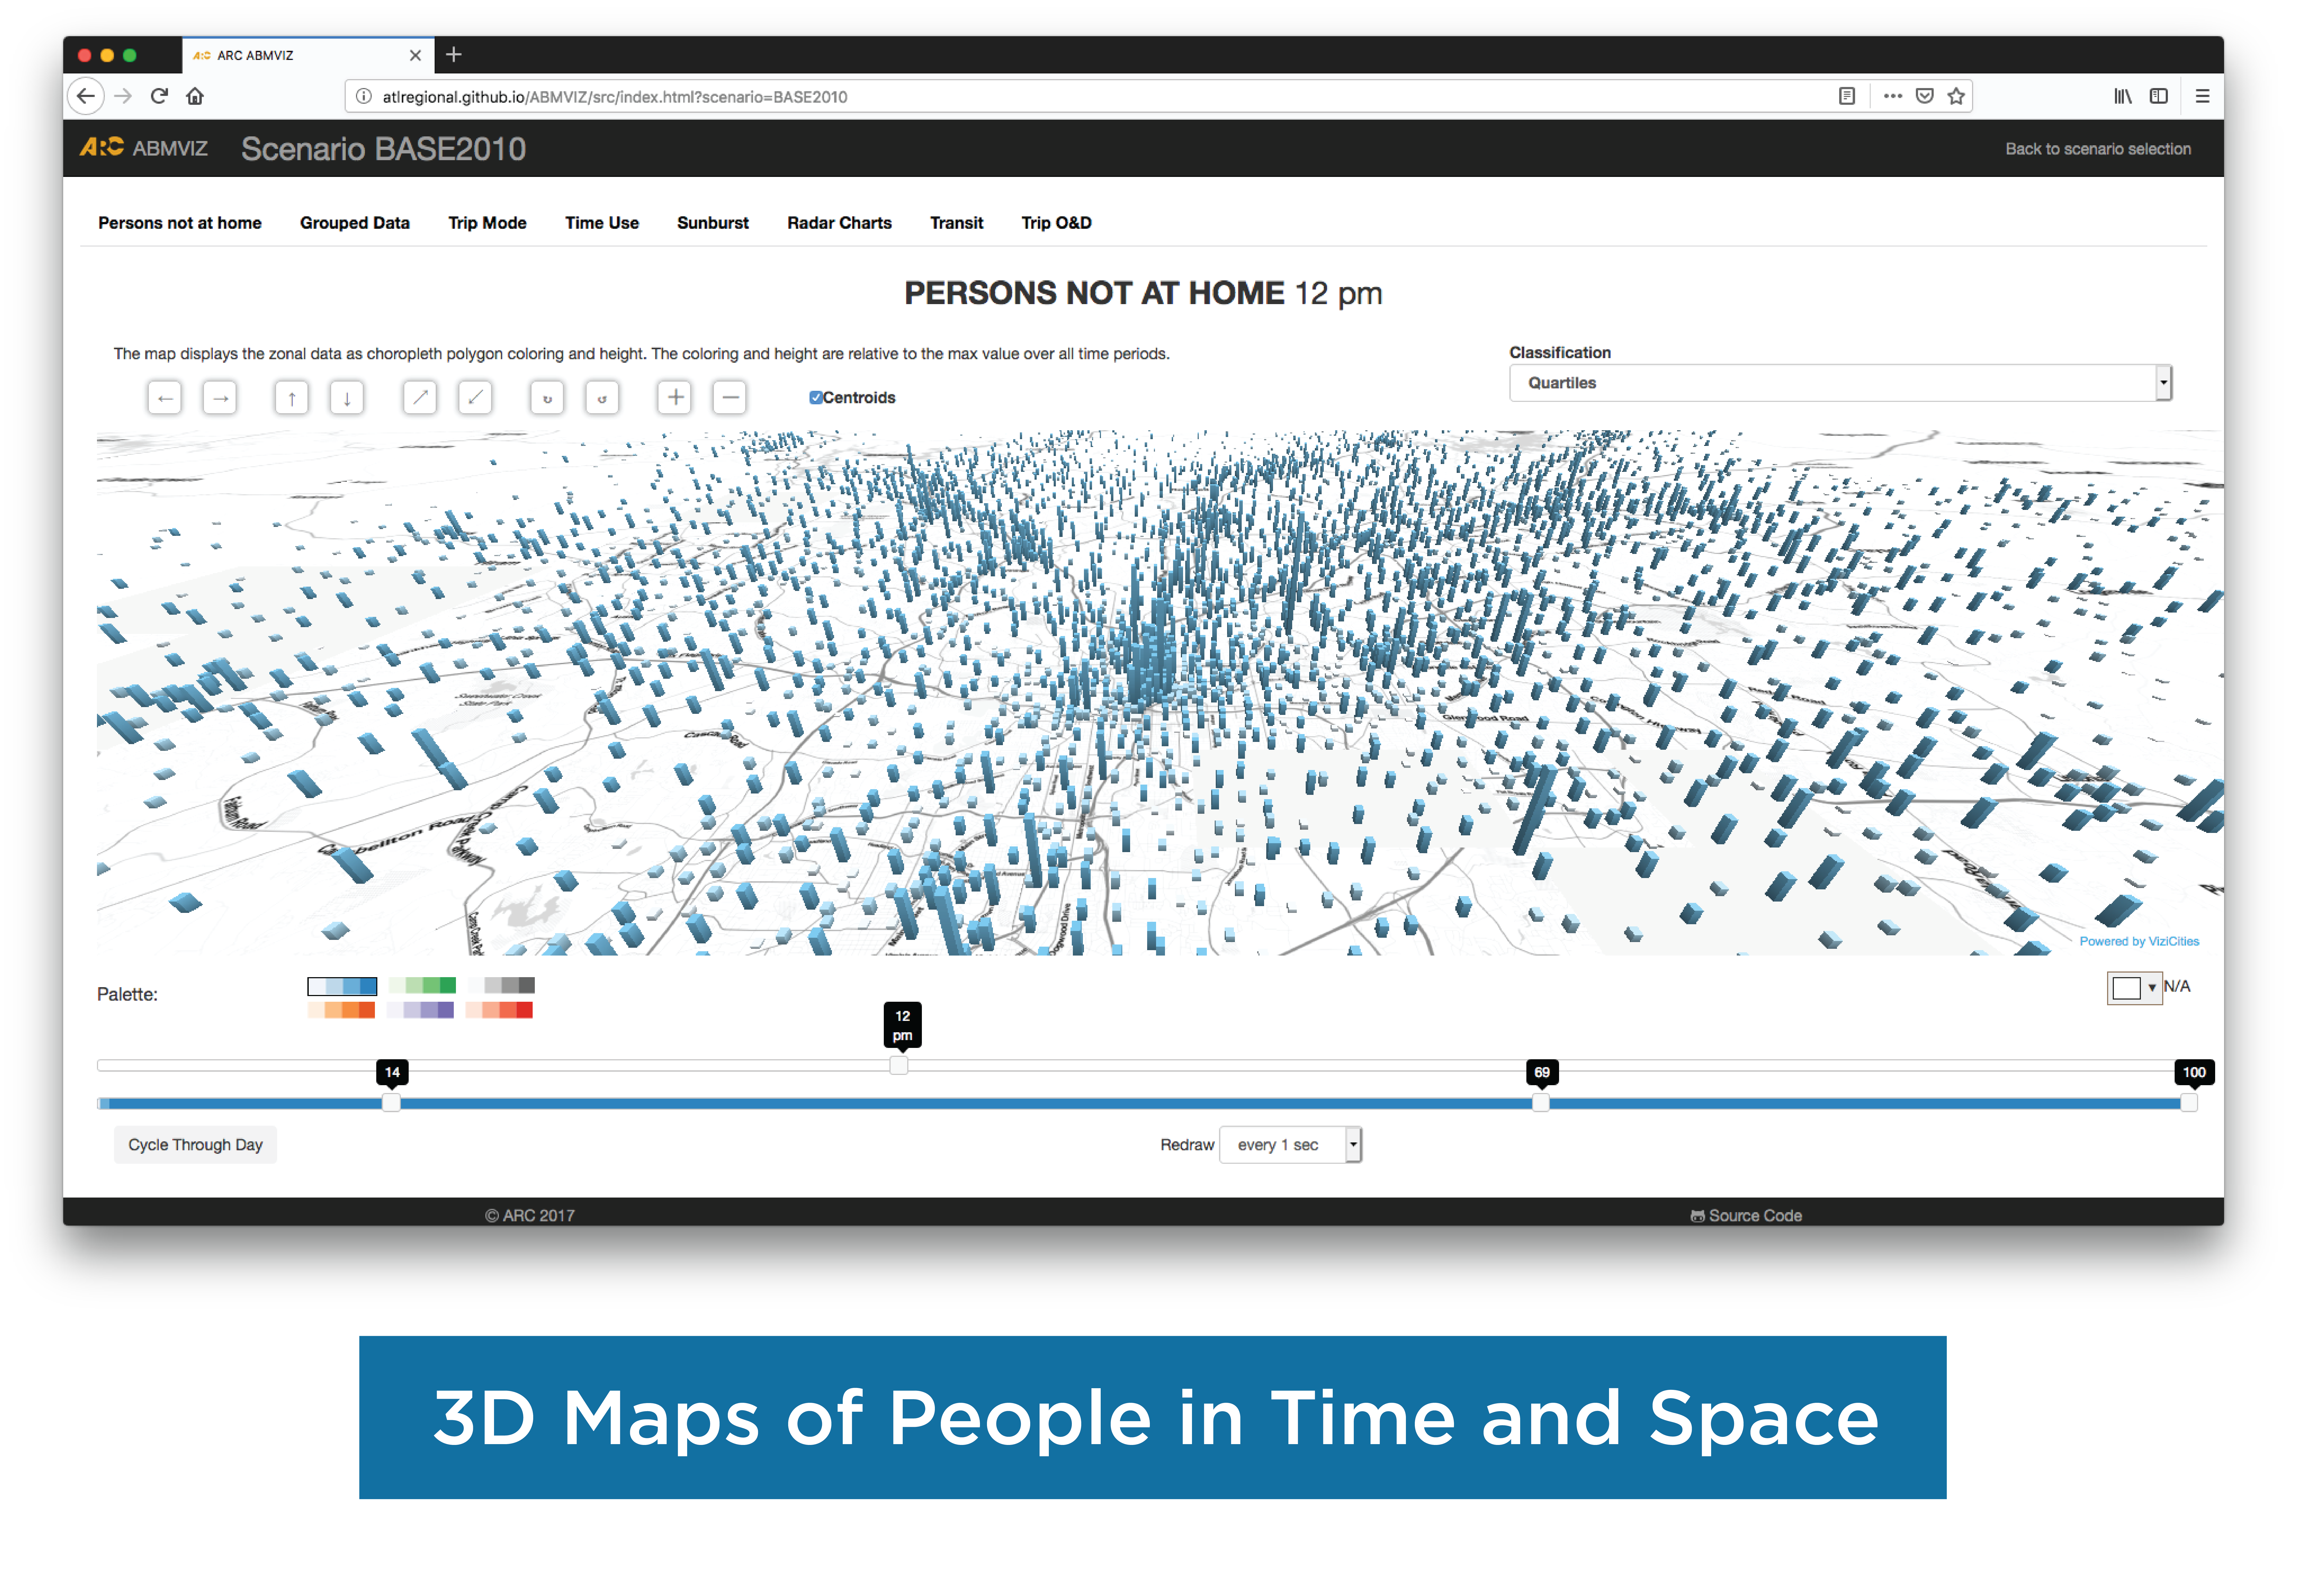
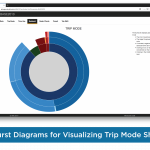
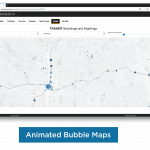
The Atlanta Regional Commission (ARC) chose RSG to migrate their desktop-based ABMVIZ travel demand model interactive visualization tool to the web. Our goal was to help ARC improve modeling outreach and user experience. To accomplish this, the new visualization tool website uses JavaScript to leverage open source data visualization libraries available for free online. The tool we delivered to ARC also features innovative interactive visualizations for exploring model scenario results. ARC can now view 3-D maps of people in time and space, person time use by person type and activity, radar charts for performance measure analysis, sunburst diagrams for visualizing trip mode shares, and animated bubble maps. In addition, we published ABMVIZ using GitHub pages, which eliminates most of the traditional administrative backend and is free for open source projects. Our improved deployment strategy made maintenance significantly easier for ARC’s modeling staff, which will allow the agency to do more with less. The versatile and easy-to-use toolkit is open source and has since been extended for use in other regions.
Related Reports & Publications

