Over the course of 20 years, RSG has designed hundreds of advanced online and mobile survey instruments to collect quantitative data for clients. We also collect tons of open-ended text comments (i.e., qualitative) data from survey respondents.
That got us thinking: Could we use open-source text mining applications and language processing tools to simplify and automate the analysis process for comments? Moreover, would any new findings help our clients better understand the perspective and sentiment of survey respondents?
To answer these questions, we tested several analysis tools on existing, anonymized text data collected over our 20 years of toll road survey work. Here’s what we found.
Toll road survey comments can reveal what is (or isn’t) on the public’s mind
RSG conducts survey-based research, which includes specialized surveys that support larger traffic and revenue studies for new roadway or bridge projects. RSG doesn’t conduct the traffic and revenue study in these cases; instead, we supply a small but critical pricing strategy component.
This critical component is a stated preference survey, which helps estimate the value of time for travelers. Using this method, respondents can state their preferences about hypothetical travel options. We then use statistical models to quantify how each attribute affects choices.
Most surveys offer respondents the chance to comment at the end. In our surveys, approximately 30% of respondents have left comments.

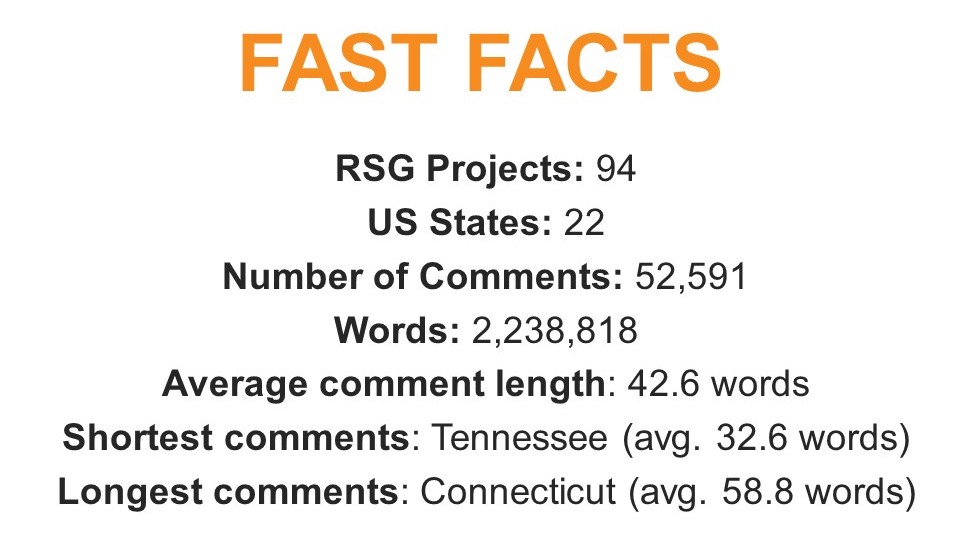
To perform our textual analysis, we compiled over 52,000 comments across 94 road pricing survey projects that RSG completed in 22 states over the past 20 years
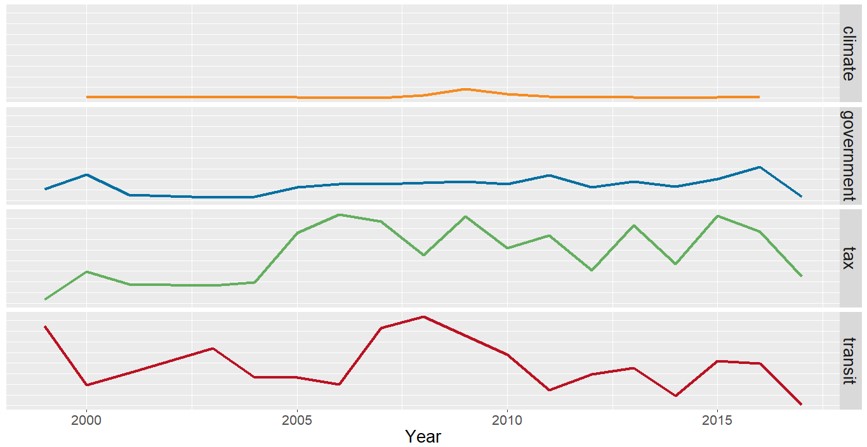
Using these comments, RSG applied text-mining tools available in R, which is a statistical analysis software program. RSG used R to track the use of words such as climate, government, tax, and transit within comments over time. These words are often politicized and associated, both negatively and positively, with major road construction projects.

We selected four words to look at word trend usage over time in respondents’ comments
Climate barely showed up in respondents’ comments (except for a small bump in 2008). Government also didn’t show up much, though it did appear more frequently than climate. Tax and transit showed up the most.
We also looked at correlations (covariates) for these same four words. We wanted to know what other words appear in comments when each of the four words selected were used by respondents.

R is a measure of the strength of correlation between the word and the covariate; covariates are from lowest to highest
Once more, with feeling
To understand emotional intent, we also performed a sentiment analysis. Doing this required a lexicon to group words into emotional categories.
We used two software packages, both in R, to perform our sentiment analysis: Quantitative Discourse Analysis Package (also known as qdap) and tidytext.
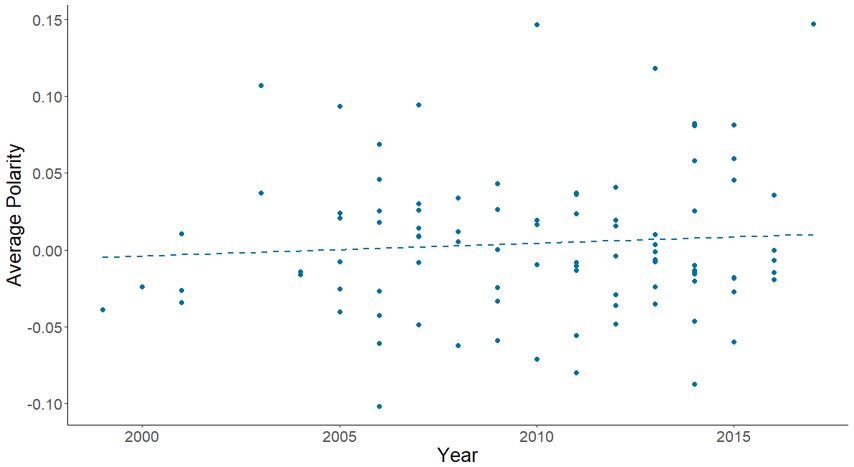
Using qdap, we obtained polarity scores for over 52,000 survey comments received to date. The most negative comments were for projects on existing untolled roads or bridges, and the most positive comments were for projects on existing tolled roads or bridges.
In addition to measuring sentiment by project type, we also analyzed sentiment over time. The figure below charts the polarity of comments over the past 20 years.
This analysis revealed a slight increase in positive comments, which runs counter to most people’s perceptions. This trend may be caused by survey populations in these regions becoming more accustomed to and less skeptical of tolled infrastructure.

qdap produced polarity scores, which rated how negative or positive a body of text is; it does this by counting and ranking words to rate a text’s positivity or negativity
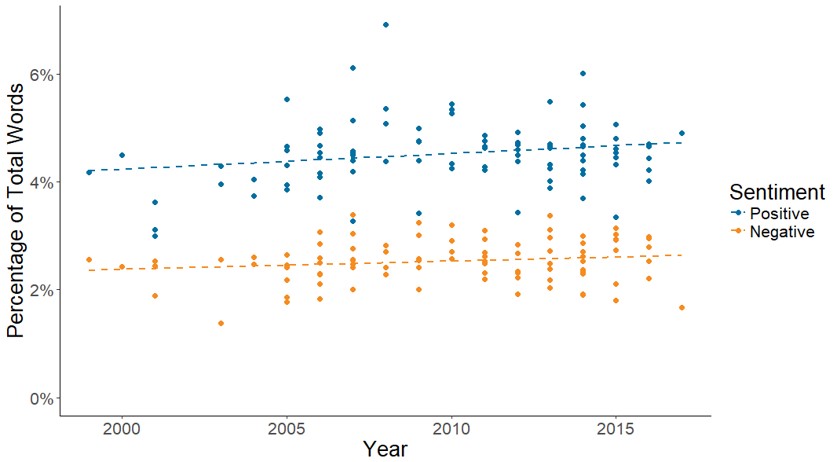
In addition to qdap, we also used tidytext to analyze the sentiment of comments received over the past 20 years. We used one of tidytext’s three lexicons to compute the percentage of positive and negative words. The tidytext analysis also demonstrated an increase in positive comments.

With tidytext, we observed a similar upward trendline of more positive comments over the last 20 years
We also looked at which two projects received the most negative or positive comments to understand the context.
Our analysis of both projects revealed something interesting about comments as a proxy for project sentiment. On both surveys, when respondents were asked to report their overall opinions of the project, the support and opposition were much more mixed and evenly distributed. In other words, the “volume” was turned up on these projects, which means they received more comments from both sides.
What the survey comments seem to reveal is not so much genuine public opinion. Instead, comments are a snapshot of what the loudest and most engaged people think on the most controversial projects.
This finding aligns with critiques of social media platforms such as Twitter, which has been found to amplify the loudest voices in the room. The result is often more trolling than substantive critiques or comments related to the topic being discussed. And, at least according to some, the trolls have won in these forums.
Open-ended survey comments have some value, but their usefulness varies
Anyone who has completed a survey with an open-ended comment section has probably wondered the same thing: Does anyone read these?
The answer, as demonstrated by our research, is often yes. However, comments’ usefulness to date in survey research has been stymied by the lack of robust and repeatable analysis methods across datasets.
Our research has revealed patterns and even sentiment from open-ended comments using qdap and tidytext, though when compared to analysts’ rankings, the accuracy of tidytext and qdap still fell short in terms of sentiment analysis. Further, the applicability of findings often depends on how the question prompt is phrased.
To that end, future survey efforts could tailor and align open-ended comment prompts to bolster their usefulness for periodic and longitudinal sentiment analysis. Comments could also help project stakeholders arrive at an approximate sense of the public’s interest or level of engagement around a project; comments may also potentially serve as a proxy for more traditional measures of civic engagement.
In an increasingly online and interconnected world, the comments section or the neighborhood Facebook group has replaced the public meeting as a forum where residents can express their opinions—with varying degrees of civility and trolling.
Moreover, according to Pew Research Center, which has aggregated expert opinion on the topic of online discourse, “prominent internet analysts and the public at large have expressed increasing concerns that the content, tone and intent of online interactions have undergone an evolution that threatens its future.”
Our analysis of open-ended comments charts one possible path forward for clients seeking additional input and engagement to bridge the digital/physical divide. Our analysis also shows it is possible to cut through the noise to arrive at the signal based on robust quantitative analysis that considers respondents’ sentiment.
However, the relative ease with which someone can comment (either negatively or positively) on a survey project means that higher profile projects will often attract more attention. For that reason, researchers would be wise to remember one thing: watch out for trolls.


