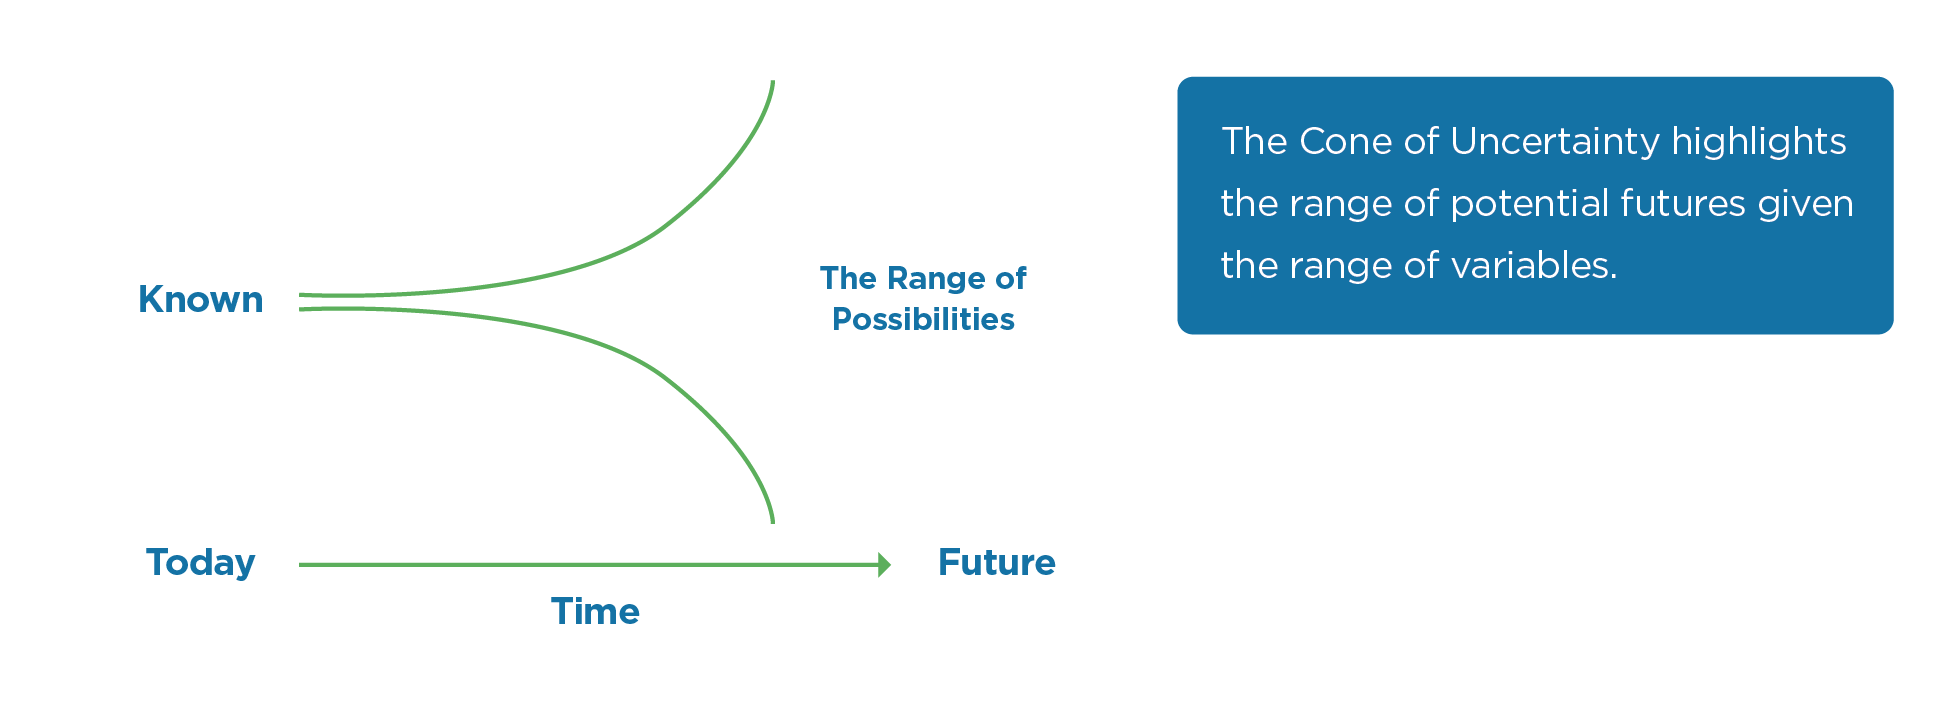
The image presents a clear and simplified representation of the Cone of Uncertainty concept in forecasting and planning. On the left side, a horizontal axis titled “Time” extends from “Today” towards “Future”. Above this timeline, a green curve starts narrowly from “Today” and expands as it progresses to “Future”, symbolizing the widening range of possibilities or uncertainties over time. This curve is labeled as “The Range of Possibilities” and contrasts with a straight line labeled “Known”, representing our current knowledge. On the right side of the image, a blue box encapsulates a text that states, “The Cone of Uncertainty highlights the range of potential futures given the range of variables.” This image underscores the inherent challenges in forecasting, as many variables can influence potential outcomes, leading to a broader scope of possibilities as we look further into the future.