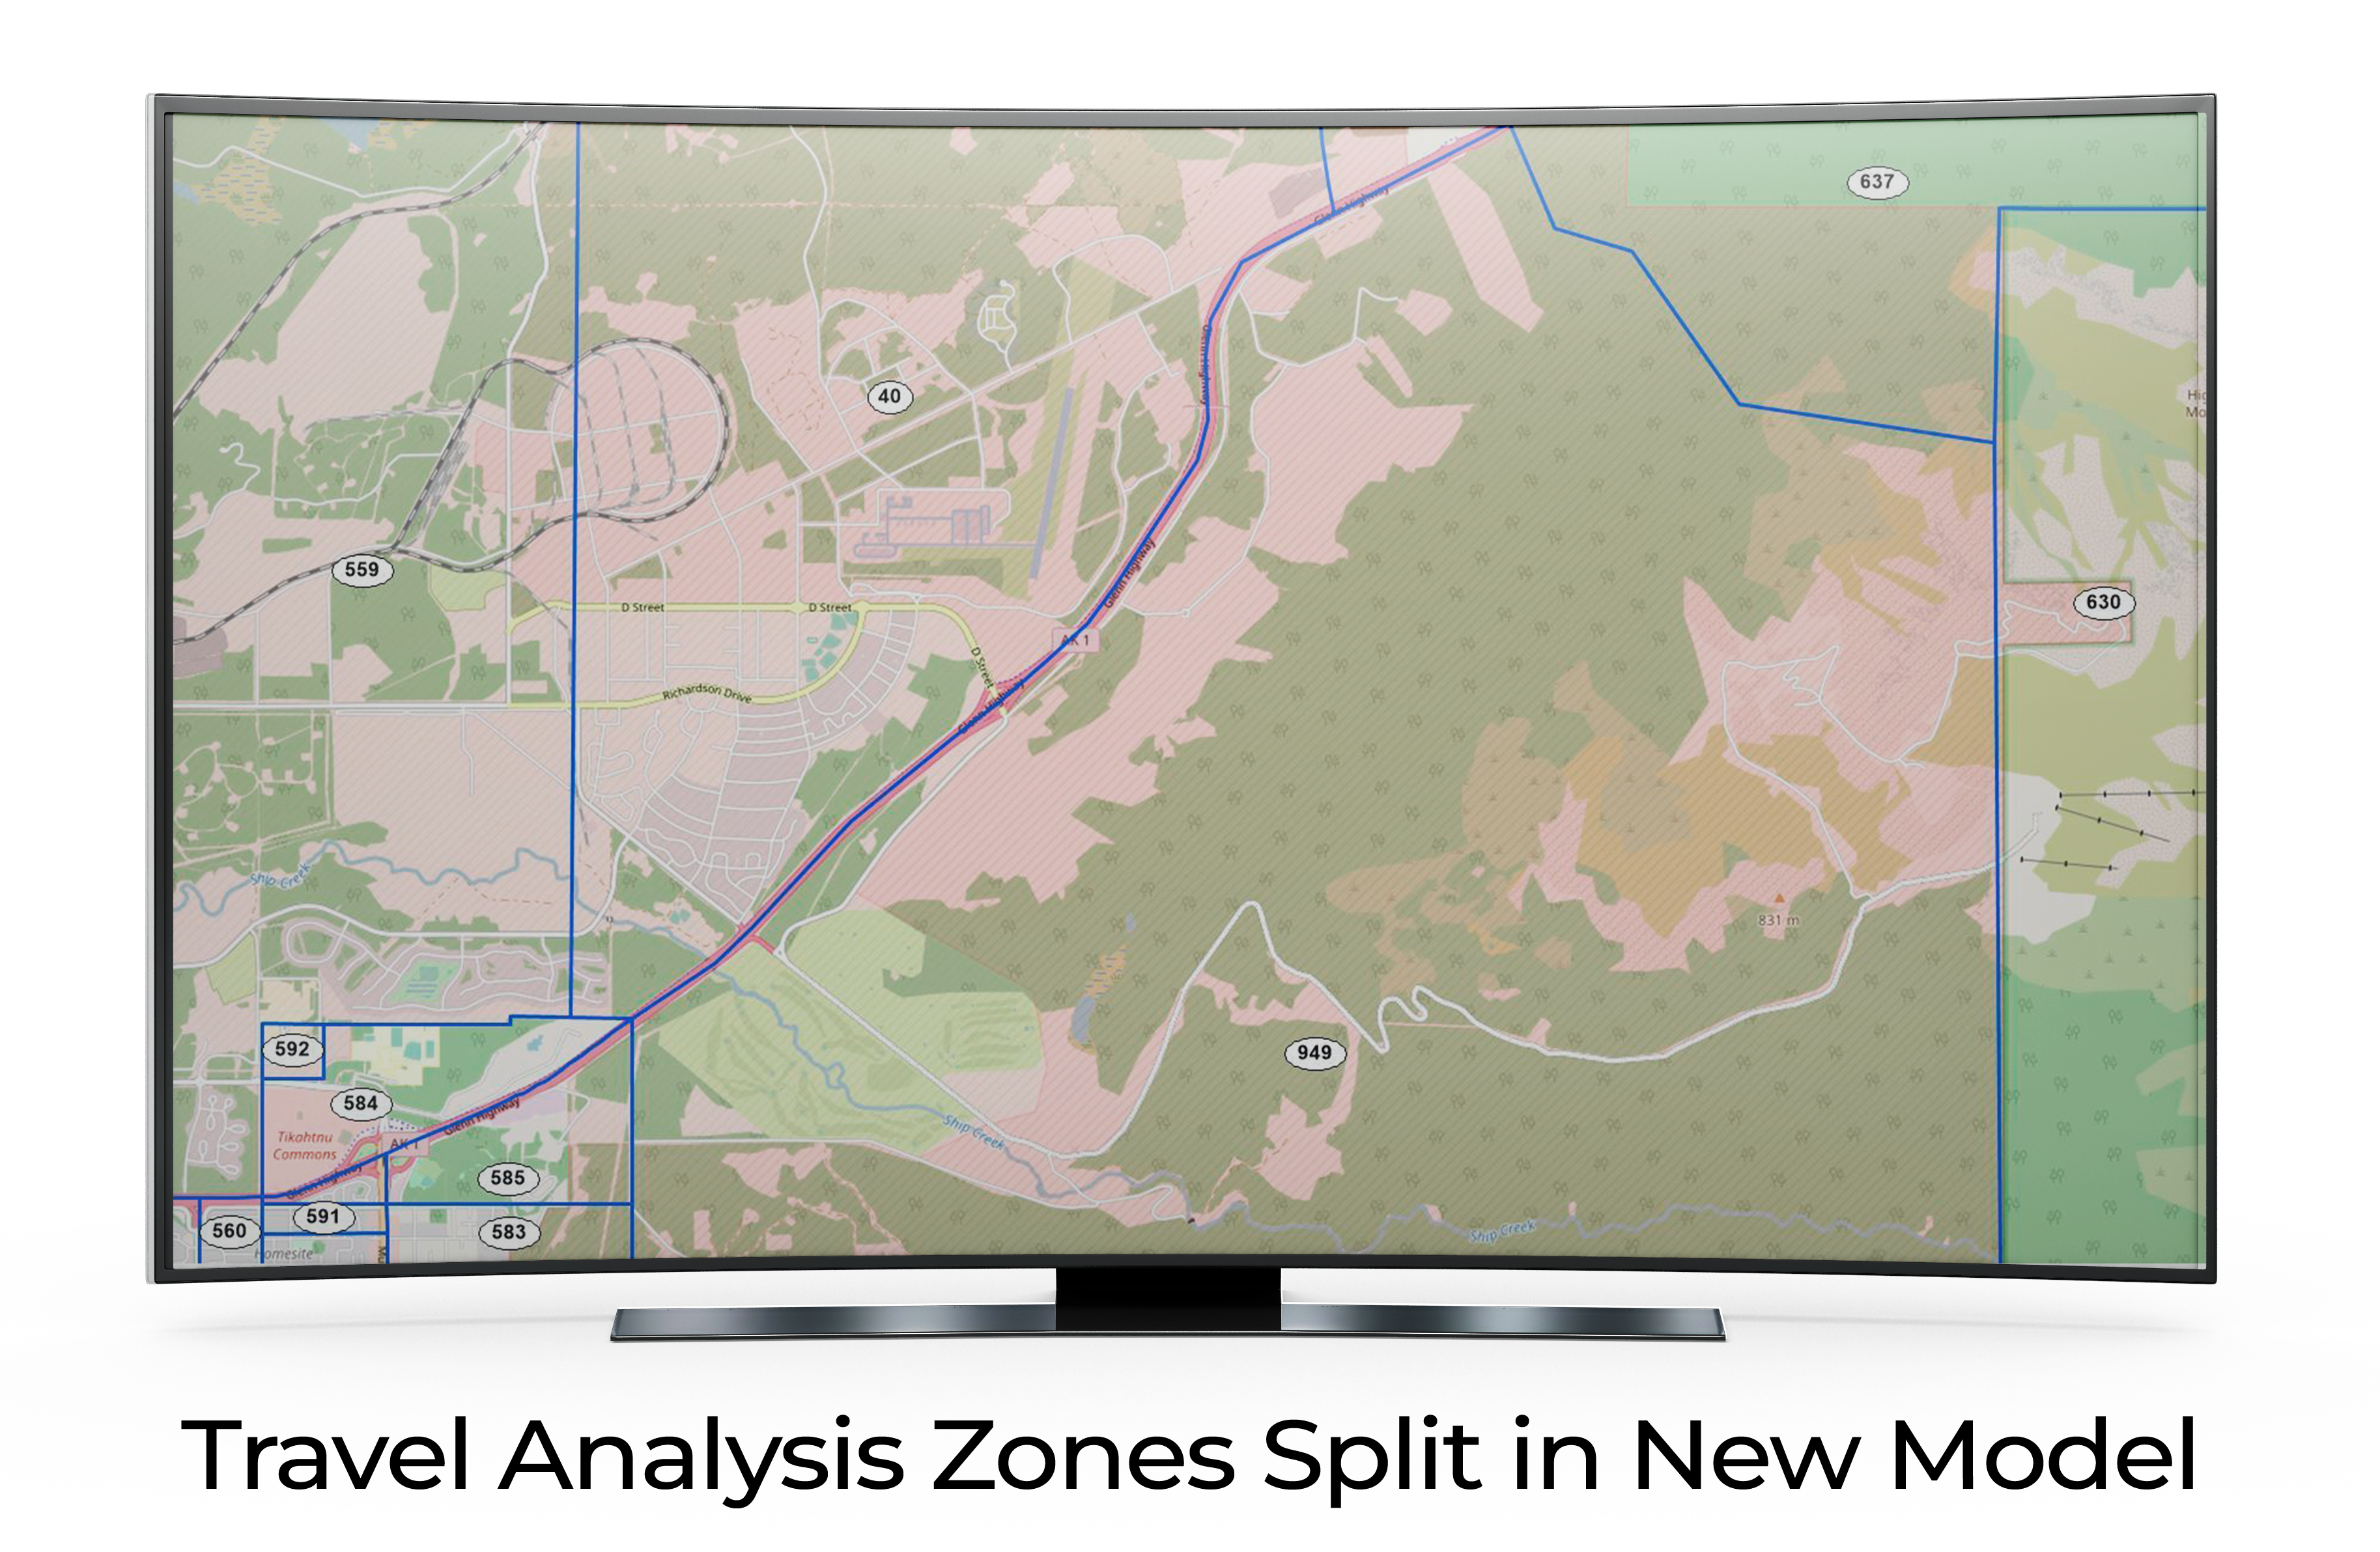
This visual displays a meticulously designed map, representing the freshly split Travel Analysis Zones in the new model. The map is enriched with distinct colorings for different zones, punctuated by specific zone numbers such as “559”, “637”, and “630”. Key roads, in varying colors, crisscross the landscape, indicating major thoroughfares and their connectivity to different zones. With clear demarcations and a detailed layout, this map serves as an indispensable tool for transportation planners and analysts aiming to understand travel patterns and infrastructure needs in the area.