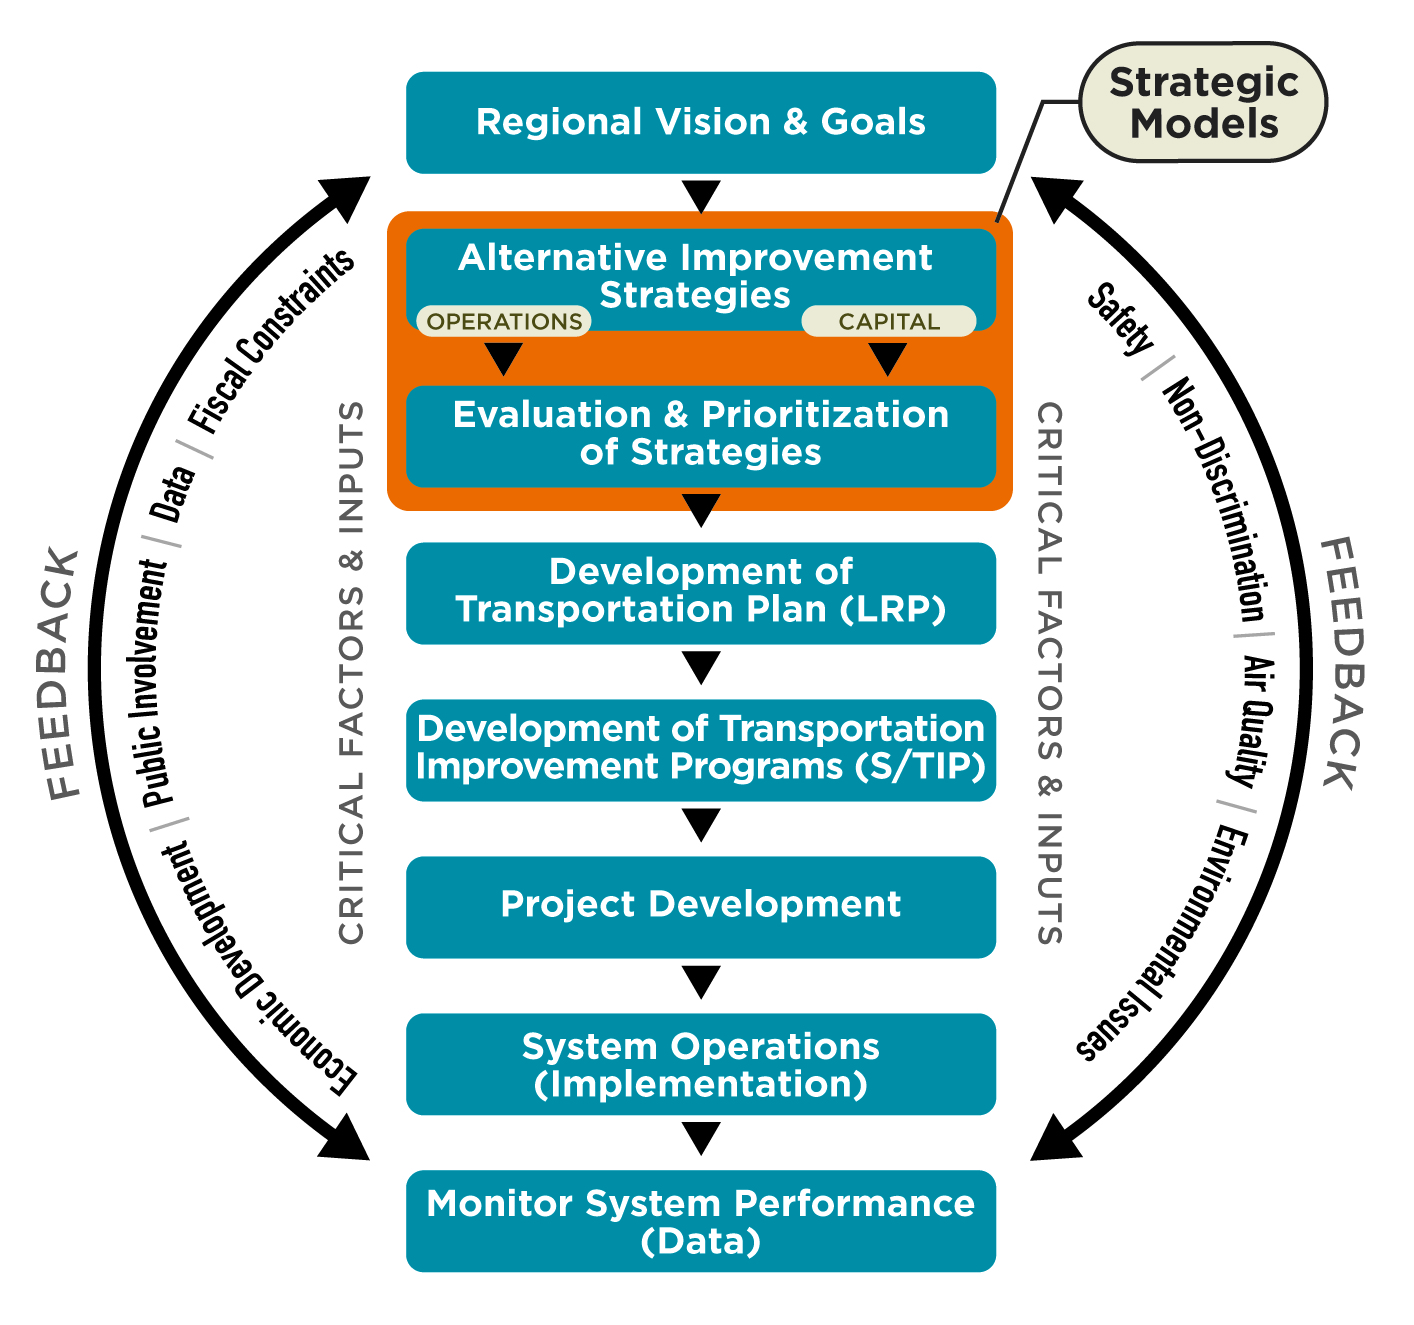
This image provides a comprehensive overview of the transportation planning process using a circular flowchart. Starting at the top, “Regional Vision & Goals” sets the foundation. This progresses to “Alternative Improvement Strategies” which distinguishes between “OPERATIONS” and “CAPITAL.” The strategies undergo an “Evaluation & Prioritization”, leading to the “Development of Transportation Plan (LRP)” and then “Development of Transportation Improvement Programs (S/TIP).” This culminates in “Project Development”, followed by “System Operations (Implementation)” and finally “Monitor System Performance (Data)”, which feeds back to the initial vision and goals. This cyclical flow is influenced by external factors depicted by two outer arcs. The left arc, labeled “FEEDBACK”, underscores the significance of “Public Involvement”, “Data”, and “Fiscal Constraints.” The right arc, also labeled “FEEDBACK”, brings attention to “Safety”, “Non-Discrimination”, “Air Quality”, and “Environmental Stewardship” as critical considerations in the process. The design illustrates the iterative nature of planning, continually informed by data and public feedback.