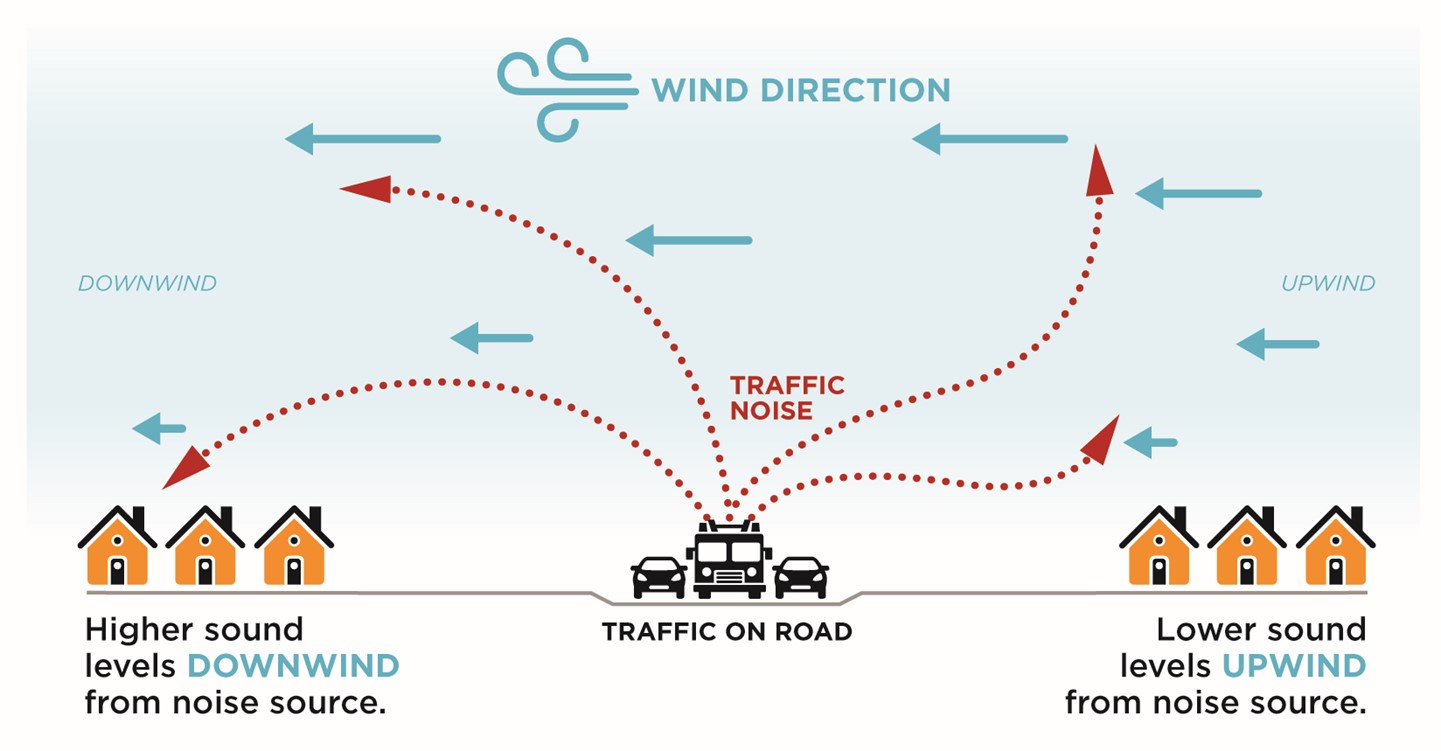
The illustration provides a visual representation of how wind direction affects the spread of traffic noise in a residential setting. A central road with vehicles is labeled as the ‘TRAFFIC ON ROAD', producing ‘TRAFFIC NOISE' which disperses in dotted lines. The wind direction is shown with arrows pointing from left to right. Two sets of houses are depicted on either side of the road. The houses situated downwind, to the left of the traffic source, are exposed to higher sound levels, while the houses upwind, to the right, experience reduced noise levels. The graphic underscores the importance of considering wind direction when assessing noise pollution in residential areas.