
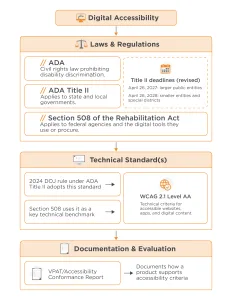
In 2024, the US Department of Justice (DOJ) finalized a rule updating Title II of the Americans with Disabilities Act (ADA). The rule established the Web Content Accessibility Guidelines (WCAG) Version 2.1, Level AA as the technical standard for web content and mobile applications provided or made available by state and local governments.
In April 2026, the Department of Justice extended the rule’s compliance deadlines by one year. Public entities serving populations of 50,000 or more now have until April 26, 2027, to comply, while smaller entities and special district governments have until April 26, 2028. Because Title II applies to the services, programs, and activities these entities offer, public agencies must ensure that contractors and vendors deliver digital tools that meet applicable accessibility requirements.
RSG did not wait for these deadlines. In 2024, we began working with Level Access, a company that specializes in accessibility, to evaluate and improve rMove® across its iOS, Android, and browser-based versions. That work produced VPAT-based Accessibility Conformance Reports (ACRs), which give our clients a clearer view of how rMove supports applicable accessibility criteria under Title II. (VPAT stands for Voluntary Product Accessibility Template.)
For RSG, accessibility is about more than meeting a technical standard. Our household travel surveys have long offered alternative ways to participate, including call centers, but many clients and participants prefer a mobile app-first experience. When that app creates barriers for some users, their experiences may be less likely to appear in the final dataset, limiting how fully that dataset represents the community and how useful it is to clients. By improving how rMove works with screen readers and other assistive technologies, we make mobile participation possible for more people.
Accessibility Is Part of Representative Research
Household travel surveys are one of the primary ways RSG helps organizations understand how people travel within a region. To accurately understand travel patterns, responses need to reflect the population that travels.
A survey method that creates barriers for some travelers works against this goal. Missing participation affects more than response rates. If people who rely on screen readers or other assistive technologies are less able to complete a survey, an agency may receive less information about how they travel and what barriers or needs they experience.
Accessibility does not, by itself, make a sample representative. Recruitment methods, language access, survey modes, incentives, nonresponse, technology access, and other factors still matter. Accessibility does, however, remove one avoidable barrier and strengthen the opportunity to hear from a broader cross-section of the traveling public.
Why RSG Committed to Making rMove Accessible
RSG began working to make rMove accessible around the same time DOJ announced changes to Title II. Some of our clients also expressed greater interest in tools that offered equal access for people with disabilities. Through conversations our team had with clients, it became clear that accessibility was moving from a specialized consideration to an expected part of how agencies procure and deploy technology.
Federal, state, and local agencies often contribute funds to support household travel surveys conducted using rMove. That investment reinforces a belief shared across RSG: tools developed for publicly funded research should be accessible to the public they serve.
Our team also recognized that mobile app accessibility for public agencies needed to guide product development rather than remain a final review step. It needed to influence how RSG designs and develops products, including decisions about interfaces, color contrast, navigation, testing, and documentation.
RSG’s Partnership with Level Access
RSG partnered with Level Access, whose digital accessibility platform and team of accessibility professionals, including users with disabilities, evaluated rMove and identified areas for improvement.
The work began with rMove’s iOS version and later expanded to Android and the browser-based version. For each platform, Level Access combined automated and manual testing to understand where the app met requirements and where it fell short. Level Access sent RSG’s software development team the findings for remediation.
Over several months, our team worked through the findings, grouping related issues, prioritizing critical items, and resolving issues across the app. The process also clarified how accessibility affects interface design, navigation, testing, and release decisions.
At the conclusion of the initial phase, RSG obtained VPAT-based ACRs for all three versions of rMove. These reports document whether individual criteria are supported, partially supported, or not supported. Rather than offering a simple pass-or-fail declaration, they show our clients how rMove conforms and help them evaluate the platform as part of their accessibility and procurement responsibilities.
RSG has continued to work with Level Access because accessibility is an ongoing responsibility, not a one-time endpoint. Our continued partnership gives our team specialized insights into accessibility as rMove and other products evolve.
What Accessibility Looks Like Inside rMove
Improving digital accessibility in transportation research did not change rMove’s core design or purpose. Instead, these changes improved how the app presents information and how participants navigate the interface, particularly when they use assistive technology. Some changes may be easily overlooked by users who do not rely on assistive technologies.
One of the more practical but technically challenging examples involved dialog boxes and pop-up windows. Before our team’s focus on rMove’s accessibility, a screen reader could continue reading buttons and other elements behind an open pop-up instead of directing the participant to the active message. In some cases, it could describe elements the participant could no longer see or use.
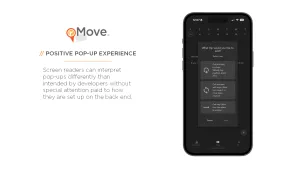
When a dialog appears in rMove, the app keeps the background visible while temporarily hiding it from any screen reader in use. This allows the rMove user to focus on the active content and move through the app in the intended order.
Other changes were also visible but subtle. rMove uses a “dark” interface and an orange-hued brand palette, both of which required careful attention to color contrast. To comply with Title II’s requirements, text, buttons, fields, and page backgrounds must be sufficiently distinct for users with impaired vision to identify where one element ends and another begins.
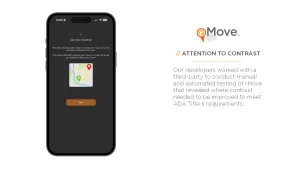
Where a text box did not contrast sufficiently with the surrounding page, our developers added borders to make the field easier to distinguish. Those borders also had to contrast with the page, the field, and nearby text while remaining consistent with the rest of the design.
Nearly every dialog and pop-up required some modification. Importantly, the result is not a fundamentally different rMove experience, but a more accessible travel survey app that more people can navigate successfully.
What Agencies Should Ask of Their Tools
As Title II compliance deadlines draw nearer, agencies should look beyond a general claim that a survey tool is “accessible.” A few questions can provide a clearer picture:
- Which versions and platforms have been evaluated? Accessibility implementation can vary across iOS, Android, and browser-based implementations.
- Which accessibility standard was used? Ask whether the tool was evaluated against an established standard and which version applies. (Remember, WCAG 2.1, Level AA is the technical standard established under the updated Title II rule.)
- Did the evaluation include automated and manual testing? Automated tools can identify many issues, but manual testing, particularly with the support of a reputable accessibility specialist or service provider, is also needed to understand how an interface behaves for people using assistive technologies.
- Is accessibility documentation available? A VPAT-based report should explain where the product supports, partially supports, or does not support individual criteria. Consider how current the documentation is, particularly when compared to any new or recently added features.
- How are updates handled? Ask how the provider evaluates interface changes made after the accessibility review and when its documentation will be refreshed.
These questions can help agencies assess both a tool’s current accessibility and how its provider maintains accessibility through design, testing, documentation, and user support.
Accessibility as a Starting Requirement
Our team’s work on rMove reinforced accessibility’s centrality to how we develop new products. We continue to apply what we learned through our work with Level Access to other applications and digital tools. Considering accessibility earlier in the process allows us to make better design choices, address barriers before they become embedded in a product, and give clients clearer documentation about the tools they make available to the public.
For household travel research, the implications of having an accessible survey tool are particularly important. Solving the transportation challenges of today and tomorrow requires understanding how the public travels now. When tools such as rMove are accessible to a broader range of survey participants, agencies have a better opportunity to collect the information they need from the communities they serve.
A tool’s accessibility does not guarantee representative survey research. That comes from decades of experience and survey best practices. But it does remove an avoidable barrier and helps more people contribute to the decisions that will shape transportation systems for years to come.
···························
Conducting accessible travel behavior research requires more than strong sampling, weighting, and survey design. It also requires understanding how the public experiences the tools used to participate. To discuss the upcoming Title II deadlines, their implications for your research program, or whether an rMove demo makes sense for your agency, contact our team.