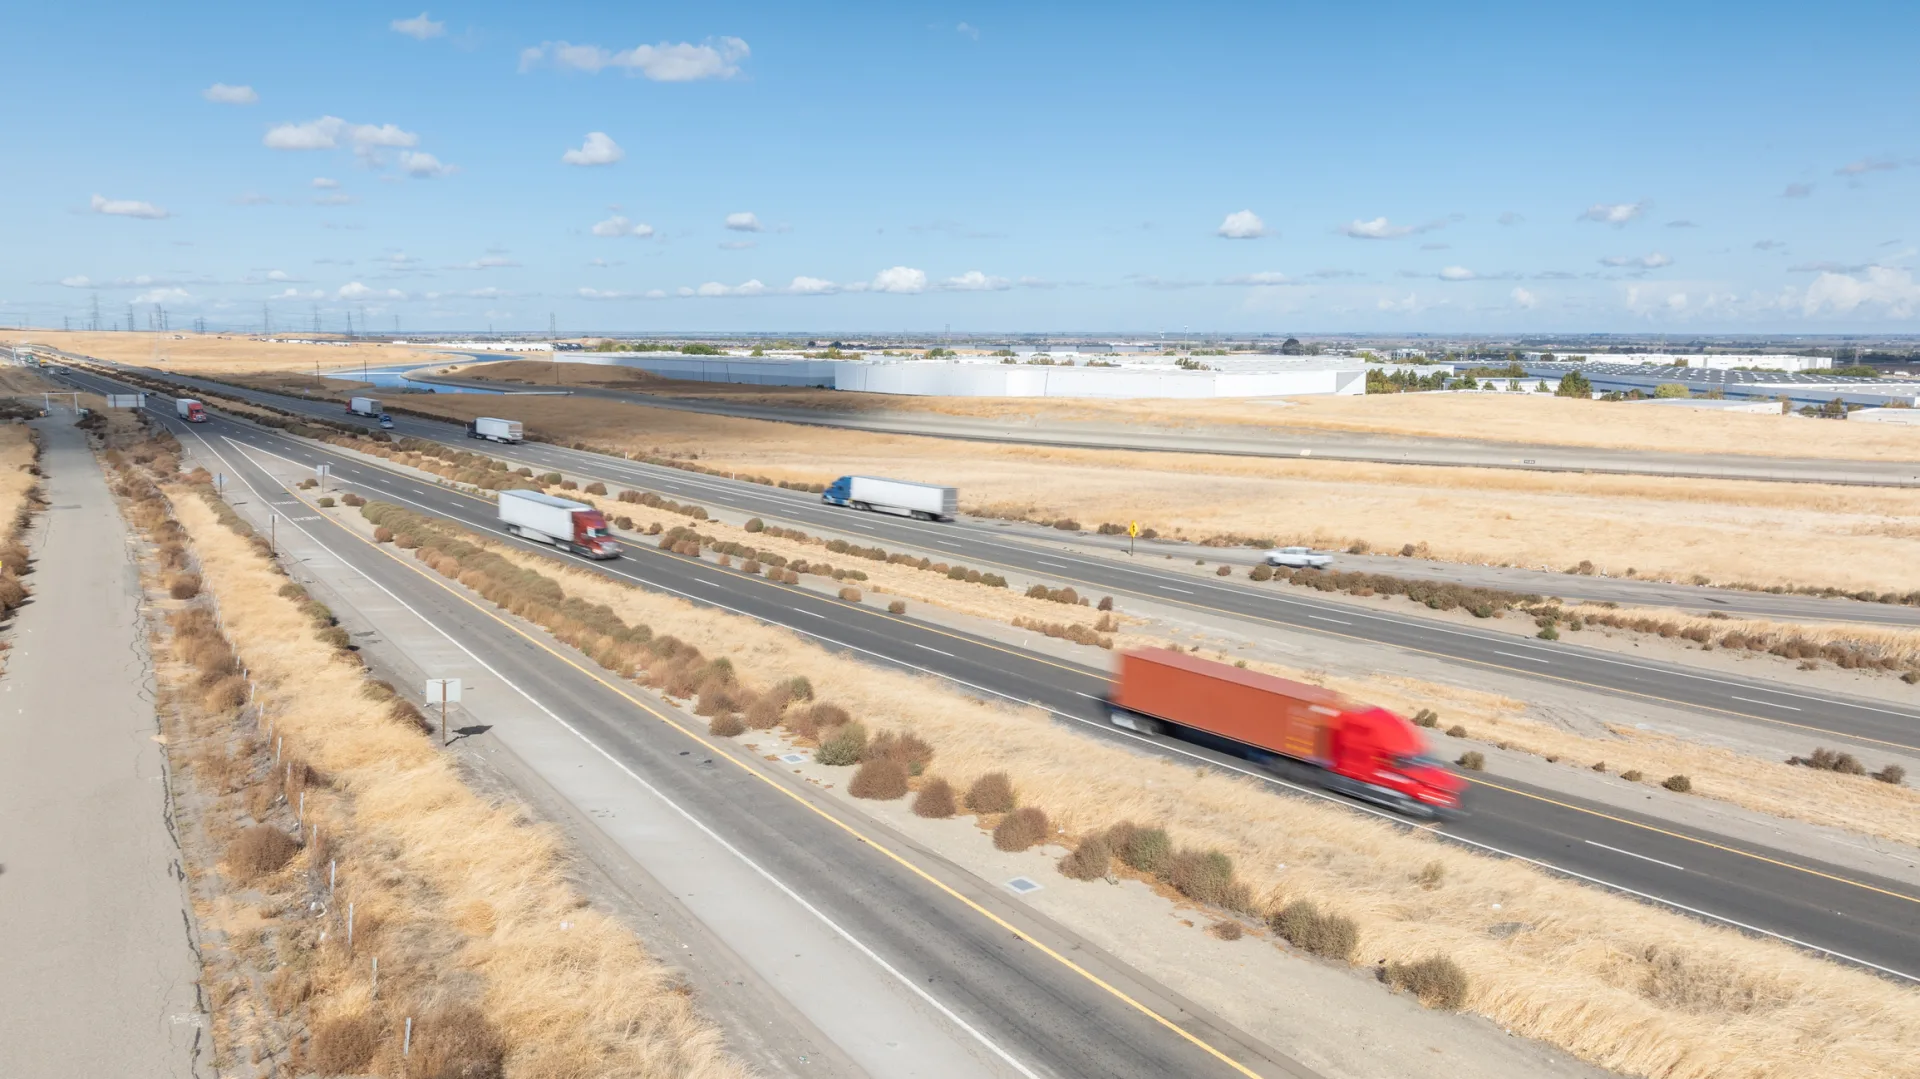
The San Joaquin Valley is one of California’s most important freight and agricultural regions, connecting farms, logistics hubs, communities, ports, and global markets. Efficient movement of freight throughout this area plays a vital role in supporting both local economies and national food supply chains. As part of California’s Central Valley, it sits within an agricultural powerhouse that produces one-quarter of the nation’s food using less than 1% of the farmland in the United States, according to the United States Geological Survey.
But climate-related risks increasingly threaten this same network that supports the region’s economy. The Valley Transport Resiliency Advancement for Neighborhoods Sustainable Freight Movement Study, or V-TRANSFRM, was designed to help the region plan for a more resilient future in freight movement. RSG supported this effort by leveraging mobility data analytics and our team’s expertise in the patterns of freight movement to better understand how trucks move across the Valley, where freight activity is most concentrated, and how improved data can help planners and policymakers make smarter climate resilience decisions.
The Challenge
For the San Joaquin Valley’s freight network to become more resilient, planners first needed a clearer picture of how that network functions today. The region is large, freight activity is dispersed, and truck travel does not stop at jurisdictional boundaries. Major highways, local roads, agricultural routes, warehouses, industrial centers, and connections to ports all work together as part of a complex system of freight movement.
Compounding the challenge was the fact that the data available to understand that system had important limitations. Existing truck counts were incomplete, especially on arterial and collector roads. Regional roadway usage and freight movement patterns were not fully understood. Existing truck models also needed updates to better reflect current conditions, including post-pandemic changes in travel behavior and freight activity.
Newer mobility data sources offered valuable additional insights but required validation. Big data can reveal where trucks are traveling, how far they go, and which corridors carry the greatest activity related to freight movement, but these sources also have limitations, including sampling gaps, geographic variation, and potential bias. To support climate resilience planning, the project team needed reliable, locally validated data that could help policymakers identify critical corridors, understand vulnerability, and prioritize investments with confidence.
RSG’s Solution
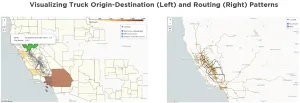
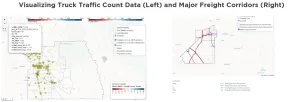
RSG applied its mobility data analytics and travel model development expertise to the V-TRANSFRM study, helping the project team move from fragmented freight data to a clearer, more actionable understanding of how goods move across the San Joaquin Valley. Using data sources such as StreetLight, Replica, and Geotab, along with truck counts and local travel behavior information, RSG helped identify major freight movement corridors, inform traffic count locations, support truck model updates, and provide truck volume inputs for climate vulnerability analysis.
An important element of RSG’s role was knowing how to use different mobility data sources responsibly. These sources can provide valuable insight into the movement of freight, but decision-makers must understand their strengths and limitations to reduce decision-making error. While data vendors apply their own weighting and expansion methods, RSG compared those freight patterns with local traffic counts and applied a second, locally focused adjustment to better align the data with observed conditions in the San Joaquin Valley.
This process provided planners with a stronger foundation for understanding freight movement by vehicle type, trip length, access patterns, and vehicle miles traveled. Furthermore, the movement of freight is easier to manage when RSG uses these data tools. These tools identify and visualize key relationships through the development of an online, interactive data visualizer that includes figures, charts, and tables, making complex freight patterns easier for stakeholders and policymakers to understand. These insights are especially important for climate resilience planning because freight volumes help clarify not only where trucks travel but also where disruptions could have the greatest operational and community impacts.
RSG also supported updates to the Valley MPOs’ truck model components so the tools used for planning and forecasting could better reflect current freight movement conditions. This included validating truck data, updating truck model inputs to 2024 conditions, refining truck trip distribution patterns using mobility data, and improving the model’s representation of truck routing and VMT. By strengthening the data that informed the model, RSG helped position the study team to evaluate freight corridors, climate vulnerabilities, and future adaptation strategies with greater confidence.
RSG’s contributions, which were the focal point of a presentation at the 2026 AEP Conference in San Diego, helped translate technical data into policy-relevant insights. Better freight movement data supports better climate resilience decisions, from where to prioritize investments to how to understand risk and plan for a goods movement network that is more reliable, practical, and aligned with the needs of the San Joaquin Valley’s communities and economy.
Download a PDF